WORKING GROUP DRAFT – IN CONFIDENCEReport on Government Services 2026
PART D, SECTION 9: RELEASED ON 3 FEBRUARY 2026
9 Emergency services for fire and other events
This section focuses on performance reporting for emergency services for fire events. Descriptive information is included on emergency services for other events, with performance reporting to be developed for future Reports.
The Indicator results tab uses data from the data tables to provide information on the performance for each indicator in the Indicator framework. The same data is also available in CSV format.
Data downloads
![]() 9 Emergency services data tables (XLSX 325.2 KB)
9 Emergency services data tables (XLSX 325.2 KB)
![]() 9 Emergency services dataset (CSV 876.6 KB)
9 Emergency services dataset (CSV 876.6 KB)
Refer to the corresponding table number in the data tables for detailed definitions, caveats, footnotes and data source(s).
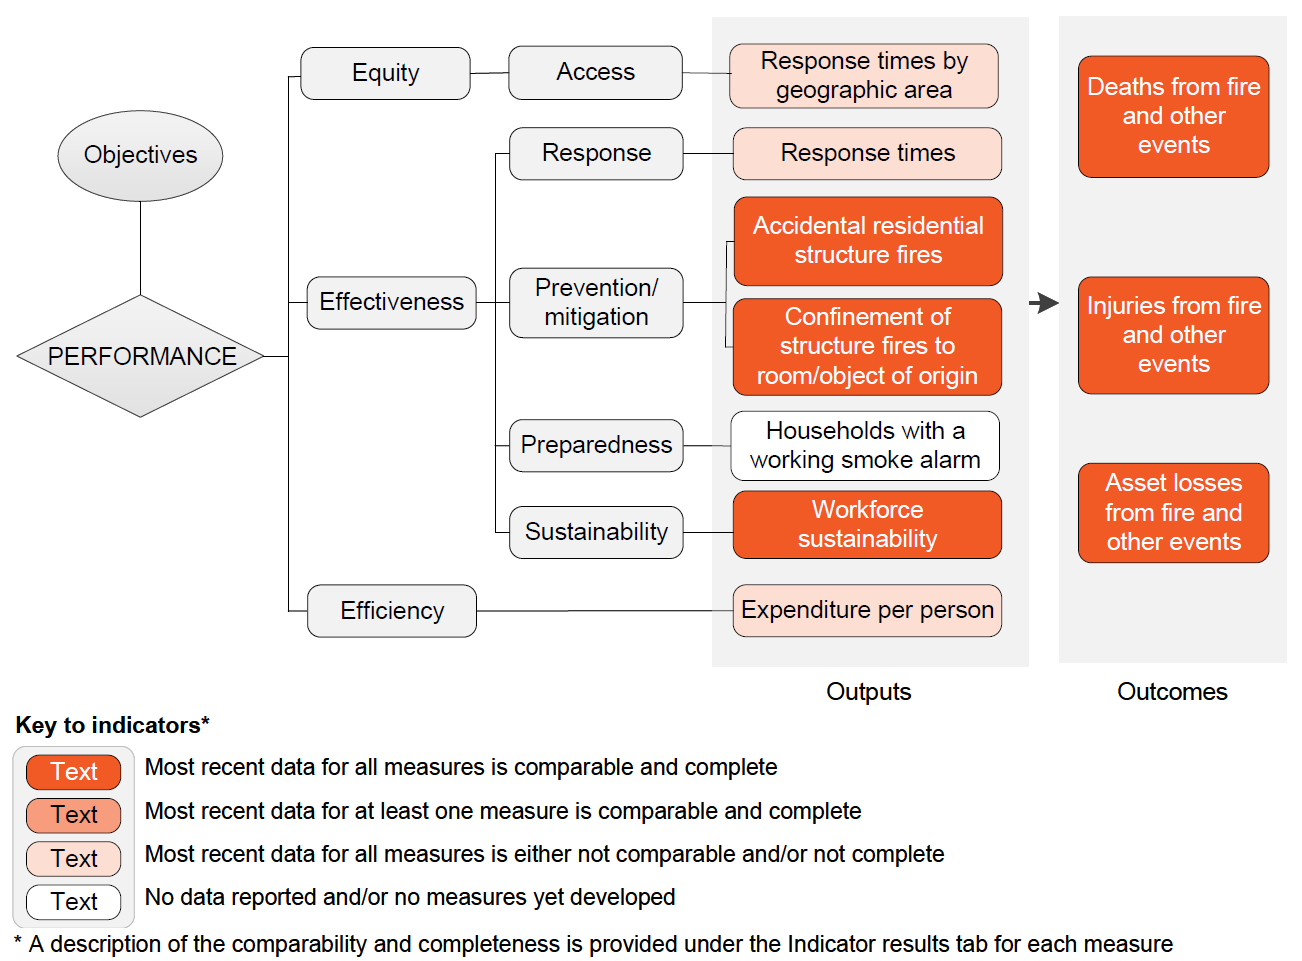
Objectives for emergency services for fire and other events
Emergency services for fire and other events aim to reduce the adverse effects of events on the community (including people, property, infrastructure, the economy and the environment). Governments seek to provide emergency services that:
- contribute to the community's management of risks and its preparedness, through the promotion of risk reduction and mitigation activities
- are accessible, responsive and sustainable.
Governments aim for emergency services to meet these objectives in an equitable and efficient manner.
An emergency event is an event that endangers or threatens to endanger life, property or the environment, and requires a significant and coordinated response. A fire event is an incident that is reported to a fire service organisation and requires a response. Fire events include (but are not limited to):
- structure fires (that is, fires inside a building or structure), regardless of whether there is damage to the structure
- landscape fires, including bushfires and grass fires, regardless of the size of the area burnt
- other fires, including vehicle and other mobile property fires, and outside rubbish fires.
Other events that require an emergency response from fire services or state and territory emergency services include road crash rescue, floods, storms and other natural disasters.
Fire service organisations and state and territory emergency services (STES) are some of the primary agencies involved in providing emergency services for fire and other events. The role of these organisations varies across jurisdictions but commonly includes prevention/mitigation, preparedness, response and recovery activities.
Each state and territory government operates multiple emergency service agencies, which service different populations and geographic areas according to specified governance arrangements (refer to table 9.1 below). Fire service and STES organisations work closely with other government departments and agencies that also have responsibilities in the case of fire and other emergency events.
This section covers the finances and activities of urban and rural fire service organisations and STES. For selected tables and jurisdictions, the fire service organisation data includes finances and activities of the relevant land management agencies.
| NSW | Fire and Rescue NSW (FRNSW); NSW Rural Fire Service (RFS) (the fire agencies); National Parks and Wildlife Service (NPWS); Forestry Corporation NSW (FCNSW) (for fire response on their managed lands) and NSW State Emergency Service (SES) (for flood, storm and tsunami). |
|---|---|
| Vic | Fire Rescue Victoria (FRV); Country Fire Authority (CFA); Forest Fire Management Victoria (FFMVic) and Victoria State Emergency Service (VICSES). |
| Qld | Queensland Fire and Emergency Services (QFES) - Fire and Rescue Service (FRS) and Rural Fire Service (RFS); State Emergency Service; Queensland Police Service; the Queensland Parks and Wildlife Service and Partnerships (QPWS&P) within the Department of Environment, Science and Innovation (including national parks, state forests and world heritage areas). |
| WA | WA Department of Fire and Emergency Services (DFES). |
| SA | South Australian Metropolitan Fire Service; South Australian Country Fire Service (CFS) and Forestry SA and SA State Emergency Service (SES). |
| Tas | Tasmania Fire Service (TFS) (for urban, structural and privately managed rural land); Tasmanian Parks & Wildlife Service (PWS) (for national parks and other reserves, including future potential production forest lands); Sustainable Timber Tasmania (STT) (for declared forest land or State forest) and Tasmania State Emergency Service (SES) (for floods, storms or severe weather, coastal inundation [storm tide]). |
| ACT | ACT Fire and Rescue; ACT Rural Fire Service (RFS); ACT Parks and Conservation Service and ACT State Emergency Service (ACTSES). |
| NT | NT Fire and Rescue Service; Bushfires NT; Parks and Wildlife Commission of the NT and NT Emergency Service (NTES) (for cyclone, earthquake, floods, storm surge and water damage and tsunami). |
Nationally in 2023-24, the total revenue of fire service organisations was $6.1 billion (including Western Australia STES), a real increase of 4.6% from 2022-23.
STES revenue (excluding Western Australia) in 2023-24 was $485.2 million, a real increase of 6.0% from 2022-23. A single department is responsible for both fire and emergency services in Western Australia and revenue cannot be separately reported for their state emergency service (including volunteer marine rescue) (table 9.2).
Funding models to resource fire service organisations and STES organisations differ across jurisdictions. For fire services in four jurisdictions (New South Wales, Victoria, the Australian Capital Territory and the Northern Territory), 50% or more of revenue was from government grants in 2023-24. In the Northern Territory, the proportion was 92.5%. Levies were the largest source of revenue (over 60%) in 2023-24 in Queensland, Western Australia, South Australia and Tasmania (table 9A.1).
For STES in 2023-24, state or territory government grants provided over 90% of revenue for Victoria, Queensland, the Australian Capital Territory and the Northern Territory. Levies were the largest revenue source in New South Wales and South Australia (over 90%) (table 9A.2).
The Australian Government provides funding to state and territory governments through programs including:
- the Disaster Recovery Funding Arrangements, which provide assistance with relief and recovery efforts following an eligible natural disaster. Allocations vary across jurisdictions and over time depending on the timing and nature of natural disaster events, and the total cost of relief and recovery from disaster events may not be completely realised for some years (Australian Government 2024).
- the Preparing Australian Communities Program Local, which supports projects that mitigate or reduce the risk, impact and consequences associated with large-scale natural hazards. In 2023-24, the Australian Government spent $39.8 million on this fund (table 9A.3)
- the Disaster Risk Reduction Fund, which supports initiatives to reduce the risk and limit the impact of disasters in line with the National Disaster Risk Reduction Framework. In 2023-24, the Australian Government provided $20.9 million in funding under this program (table 9A.3)
- the Disaster Ready Fund, which commenced on 1 July 2023 and supports projects for disaster resilience and risk reduction. In 2023-24, the Australian Government provided $200.0 million in funding under this program (table 9A.3).
In 2023-24, the Australian Government also provided $80.5 million in disaster recovery payments to eligible individuals affected by a disaster (table 9A.3).
Human resources
Nationally in 2023-24, 23,936 full-time equivalent (FTE) paid personnel were employed by fire service organisations, with the majority (74.9%) being firefighters. A large number of volunteer personnel (189,041 people) also participated in the delivery of services in 2023-24, an increase of 0.2% from 2022-23. Nationally, the numbers of volunteer personnel (both firefighters and support staff) have decreased by 14.3% over the reported time series (2014-15) (table 9A.4).
For STES, the majority of personnel were volunteers. In 2023-24 there were 24,357 STES volunteers, similar to 2022-23 (24,750 volunteers). There were also 3,082 paid staff in 2023-24. The proportion of volunteer and paid personnel and the nature of their roles varied across jurisdictions (table 9A.5).
Demand for emergency services
Fire service organisations and STES provide emergency response and rescue services for a range of fire and other emergency events. Nationally in 2023-24, fire service organisations attended 452,292 emergency incidents, of which 95,525 were fire events. Fire service organisations also responded to other incident types including road crash rescues, floods and storms, and other hazardous conditions. The number of emergency incidents that fire service organisations responded to over the past five years (since 2018-19) increased by 15.5% (table 9A.6).
In 2023-24, STES organisations (excluding Queensland) attended 73,025 incidents, the majority of which were storm and cyclone events (68.0% or 49,643 events). The number of incidents requiring STES attendance over the past five years (since 2018-19) has increased by 4.4% (table 9A.7).