WORKING GROUP DRAFT – IN CONFIDENCEReport on Government Services 2026
PART C, SECTION 8: RELEASED ON 3 FEBRUARY 2026
8 Corrective services
This section reports on prison custody and a range of community corrections orders and programs for adult offenders which are delivered separately by the eight states and territories.
The Indicator results tab uses data from the data tables to provide information on the performance for each indicator in the Indicator framework. The same data in the data tables are also available in CSV format.
Data downloads
![]() 8 Corrective services data tables (XLSX 131.8 KB)
8 Corrective services data tables (XLSX 131.8 KB)
![]() 8 Corrective services dataset (CSV 222.7 KB)
8 Corrective services dataset (CSV 222.7 KB)
Refer to the corresponding table number in the data tables for detailed definitions, caveats, footnotes and data source(s).
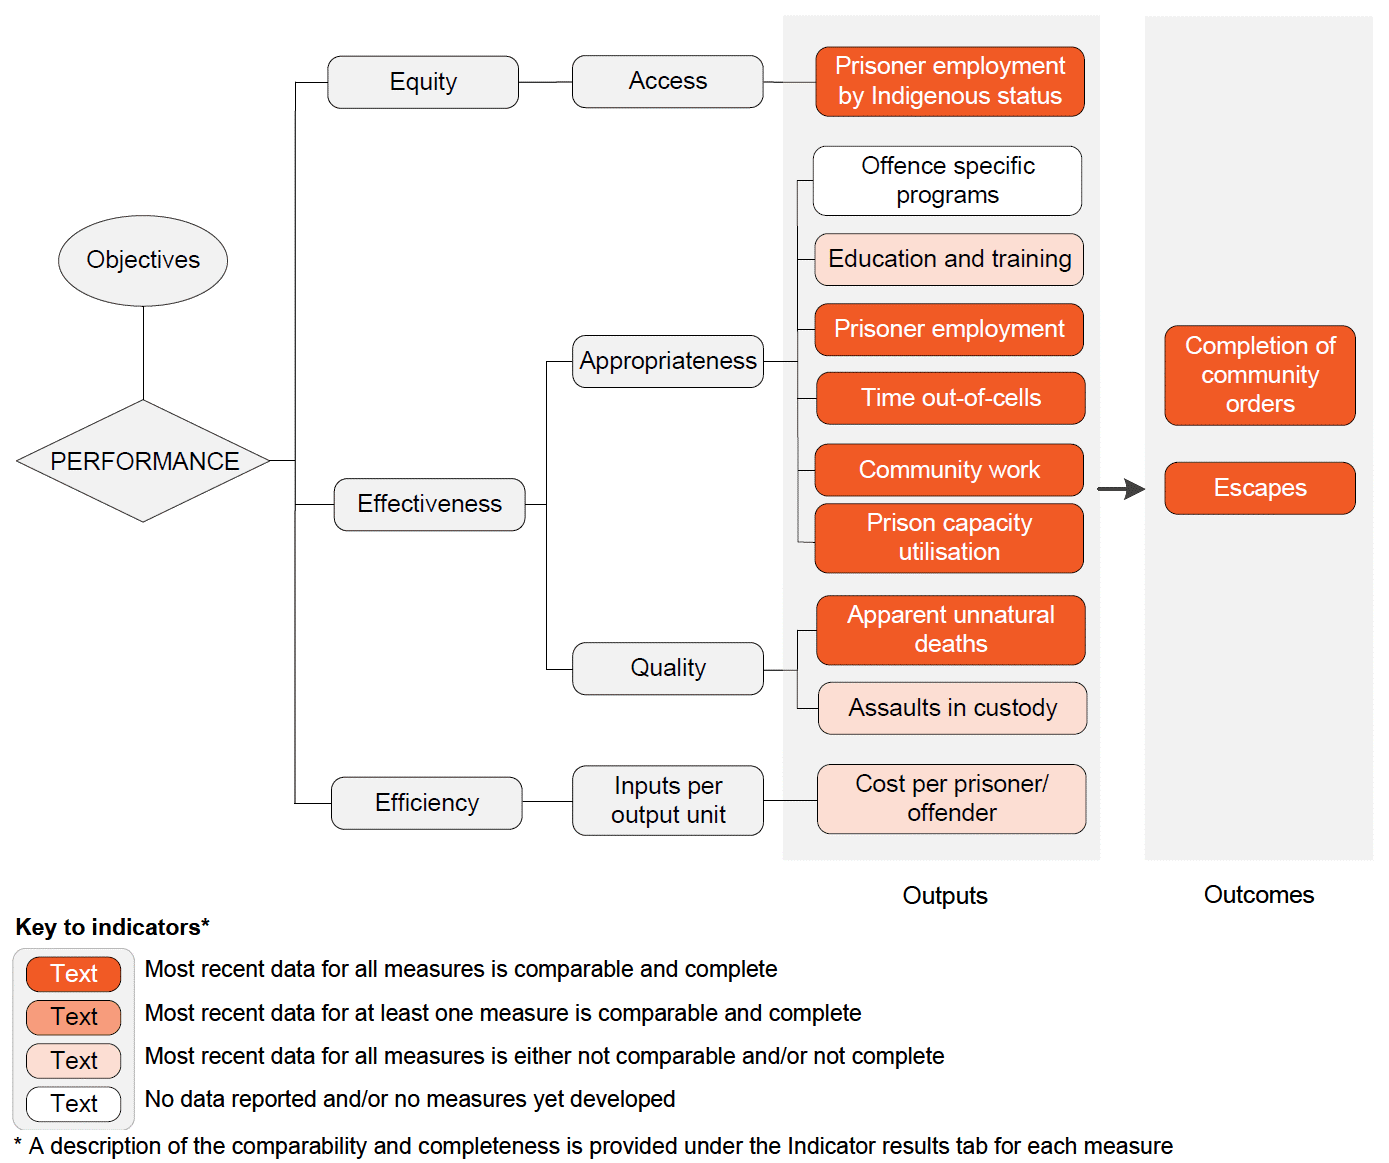
Objectives for corrective services
Corrective services aim to contribute to the protection and creation of safer communities through the effective management of offenders and prisoners, commensurate with their needs and the risks they pose to the community, by providing:
- a safe, secure and humane custodial environment
- appropriate management of community corrections orders
- programs and services that address the causes of offending, maximise the chances of successful reintegration into the community, and encourage offenders to adopt a law abiding way of life.
Governments aim for corrective services to meet these objectives in an equitable and efficient manner.
The operation of corrective services is significantly influenced by, and in turn influences, other components of the criminal justice system such as police services and courts. The management of prisoners and of offenders serving community corrections orders is the core business of all corrective services agencies. However, the legislative frameworks governing and impacting on corrective services, for example sentencing acts, vary widely. The scope of the responsibilities of these agencies also varies, for example, functions administered by corrective services in one jurisdiction may be administered by a different justice sector agency in another, such as the management of prisoners held in court cells.
This section reports on the performance of corrective services, which include prison custody and a range of community corrections orders and programs for adult offenders1 (for example, parole and community work orders). Both public and privately operated correctional facilities are included; however, the scope of this section generally does not extend to:
- youth justice (reported on in section 17, Youth justice services)
- prisoners or alleged offenders held in forensic mental health facilities to receive psychiatric care (who are usually the responsibility of health departments)
- prisoners held in police custody (reported on in section 6, Police services)
- people held in facilities such as immigration detention centres.
- Adult offenders in prison and community corrections are aged 18 years and over in all Australian states and territories. Locate Footnote 1 above
Corrective services are the responsibility of state and territory governments, which may deliver services directly, purchase them through contractual arrangements or operate a combination of both arrangements. All jurisdictions maintained government operated prison facilities during the reporting period while private prisons operated in five jurisdictions (New South Wales, Victoria, Queensland, Western Australia and South Australia).
Community corrections is responsible for administering a range of non-custodial sanctions and also manages prisoners who are released into the community and continue to be subject to corrective services supervision. These services vary in the extent and nature of supervision, the conditions of the order (such as a community work component or a requirement to attend an offender program) and the level of restriction placed on the offender’s freedom of movement in the community (for example, home detention).
No single objective or set of characteristics is common to all jurisdictions’ community corrections services, other than that they generally provide a non-custodial sentencing alternative or a post-custodial mechanism for reintegrating prisoners into the community under continued supervision. In some jurisdictions, community corrections responsibility includes managing offenders on supervised bail orders. Table 8.1 shows the range of sanctions involving corrective services that operated in each jurisdiction during the reporting period.
| NSW | Vic | Qld | WA | SA | Tas | ACT | NT | ||
|---|---|---|---|---|---|---|---|---|---|
| Community corrections | Supervised bail | ||||||||
| Conditionally deferred or suspended conviction/sentence | |||||||||
| Fine option/conversion order | |||||||||
| Community service order | |||||||||
| Probation, community based order, Supervised good behaviour bond | |||||||||
| Supervised suspended sentenceb | |||||||||
| Intensive corrections/intensive supervision order | |||||||||
| Home detention orderc,d | |||||||||
| Post-prison order e.g. parole, release on licence | |||||||||
| Post-sentence supervision order | |||||||||
| Prison custody | Remand (unconvicted or unsentenced) | ||||||||
| Periodic detentione | |||||||||
| Imprisonment | |||||||||
| Transition/re-entry order | |||||||||
| Post-sentence detention order |
![]() Sanction administered
Sanction administered ![]() Sanction not administered
Sanction not administered
a This table relates to whether there are offenders or prisoners being managed by corrective services in accordance with the requirements of the particular sanction at 30 June of the reporting period. It may therefore show as applicable a sanction that is no longer in force as a sentencing option for the jurisdiction at that time because there are still offenders/prisoners within the corrective service population that have not yet completed an order handed down by the court before that type of sanction was removed as an option for courts to use. b New South Wales is no longer administering new supervised suspended sentences although there are still a number of offenders currently being supervised under this sanction. c Includes home detention as a condition of bail where supervised by corrective services. d In Tasmania, legislation allowing sentencing to Home Detention Orders was proclaimed in December 2018. The first such orders commenced in March 2019. e No jurisdiction operated periodic detention in 2022-23.
Source: State and territory governments (unpublished).
Nationally in 2023-24, expenditure (net of revenue) on corrective services was $5.02 billion for prisons and $0.89 billion for community corrections2 (table 8A.1). Expenditure plus depreciation (matching expenditure reporting by other justice sector agencies) was $6.52 billion – a real increase of 3.4% from 2022-23 (table 8A.2). Changes in expenditure need to be considered in the context of the growth in corrective services populations over time.
- This expenditure is net of operating revenues and excludes capital costs (depreciation, user cost of capital and debt service fees), payroll tax, and expenditure on transport/escort services and prisoner health. Some jurisdictions are unable to fully disaggregate transport costs and/or health expenditure from other prison operating costs. Refer to table 8A.1 for detailed definitions, footnotes and caveats. Locate Footnote 2 above
Prison custody
Corrective services operated 113 custodial facilities nationally at 30 June 2024, comprising 86 government operated prisons, 9 privately operated prisons, 4 transitional centres, and fourteen 24-hour court cell complexes (holding prisoners under the responsibility of corrective services in New South Wales) (table 8A.3).
On average, 43,001 people per day were held in Australian prisons during 2023-24, of which 84.0% were held in secure facilities (table 8A.4). A daily average of 7,807 prisoners (18.2% of the prisoner population), were held in privately operated facilities during the year. Nationally, female prisoners represented 7.7% of the daily average prison population, and Aboriginal and Torres Strait Islander prisoners represented 34.5% of the daily average population.
In 2023-24, the national imprisonment rate was 202.9 per 100,000 people in the relevant adult population (figure 8.1). There is a slight increase compared to 2022-23 and a decrease of 6.5% since 2017-18 (figure 8.1). The rate for males (381.1 per 100,000 males) was 12.5 times the rate for females (30.6 per 100,000 females) (table 8A.8).
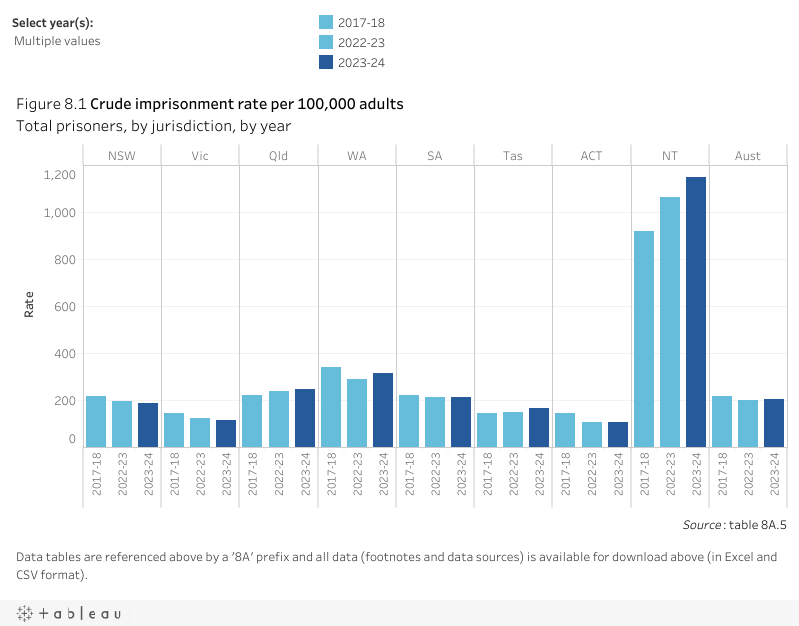
The national crude imprisonment rate per 100,000 Aboriginal and Torres Strait Islander people was 2,334.0 in 2023-24 compared with a rate of 135.1 for the non-Indigenous population (table 8A.8). Comparisons of imprisonment rates should be made with care, especially for states and territories with relatively small Aboriginal and Torres Strait Islander populations. Small changes in prisoner numbers can cause variations in rates that do not accurately represent either real trends over time or consistent differences from other jurisdictions.
The Aboriginal and Torres Strait Islander population has a younger age profile compared with the non-Indigenous population, which contributes to higher crude imprisonment rates. After adjusting for differences in population age structures, the national age-standardised imprisonment rate per 100,000 Aboriginal and Torres Strait Islander people in 2023-24 was 1,936.7, compared with a corresponding rate of 145.6 for the non-Indigenous population (figure 8.2). Therefore, after taking into account the effect of differences in the age profiles between the two populations, the national imprisonment rate for the Aboriginal and Torres Strait Islander population is 13.3 times greater than for the non-Indigenous population. Imprisonment rates that do not take age profile differences into account are 17.3 times greater.
While imprisonment rates for the Aboriginal and Torres Strait Islander population, whether calculated on a crude or age-standardised basis, are higher than those for the non‑Indigenous population, the majority of daily prisoners are non‑Indigenous. Seven-year trends in daily average numbers and rates for Aboriginal and Torres Strait Islander and non‑Indigenous prisoners are reported in table 8A.5.
Community corrections
Nationally, on a daily average, there were 15.6 offenders for every (full time equivalent) community corrections staff member in 2023‑24 (table 8A.9). Nationally, an average of 82,627 offenders per day were serving community corrections orders in 2023-24 (table 8A.7), with female offenders representing 19.4% of the offender population (higher than the proportion in the prison population), and Aboriginal and Torres Strait Islander offenders representing 25.6% of the offender population (lower than the proportion in the prison population) (table 8A.6).
In 2023-24, the national crude community corrections rate was 389.9 per 100,000 relevant adult population. This is 8.0% higher than the rate of 360.9 in 2017-18 (figure 8.3). The rate for female offenders was 148.8 compared with 638.8 for male offenders (table 8A.8).
The national crude community corrections rate for the Aboriginal and Torres Strait Islander population was 3,325.0 offenders per 100,000 relevant adult population, compared with 288.6 offenders for the non-Indigenous population (table 8A.8). After adjusting for differences in population age structures, the age-standardised rate per 100,000 Aboriginal and Torres Strait Islander population in 2023‑24 was 2,717.5, compared with a rate of 295.4 for the non-Indigenous population (figure 8.4). Therefore, after taking into account the effect of differences in the age profiles between the two populations, the national Aboriginal and Torres Strait Islander community corrections rate is 9.2 times greater than for the non-Indigenous population. Community corrections rates that do not take age profile differences into account are 11.5 times greater.
As with prisoners, comparisons should be made with care because small changes in offender numbers in jurisdictions with relatively small Aboriginal and Torres Strait Islander populations can cause variations in rates that do not accurately represent either real trends over time or consistent differences from other jurisdictions. Seven-year trends are reported in table 8A.7.