WORKING GROUP DRAFT – IN CONFIDENCEReport on Government Services 2026
PART C: RELEASED ON 3 FEBRUARY 2026
C Justice
Data downloads- this block to be deleted
These data tables relate to the sector as a whole. Data specific to individual service areas is in the data tables under the relevant service area.
![]() Justice data tables (XLSX 33.3 KB)
Justice data tables (XLSX 33.3 KB)
Refer to the Sector overview text and corresponding table number in the data tables for detailed definitions, caveats, footnotes and data source(s).
Note: Data tables are referenced by table xA.1, xA.2, etc. with x referring to the section or overview. For example, table CA.1 refers to data table 1 for this sector overview.
Main aims of services within the sector
The justice sector services aim to contribute to a safe and secure community and promote a law-abiding way of life.
Figure to be deleted
Figure C.1 Flows through the criminal justice system a, b, c
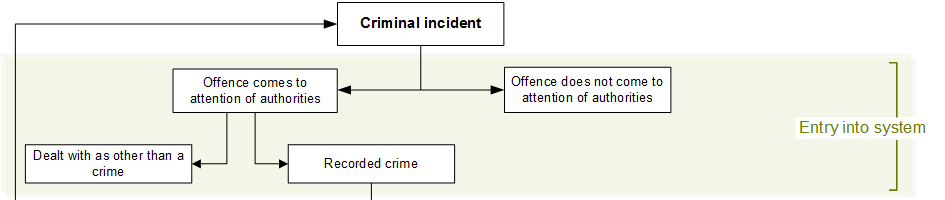
image to go here
Police services
Deliver services to preserve public order, investigate crime and apprehend offenders, improve road safety and support the judicial process.
- Total state and territory government real recurrent expenditure on police services was $16.4 billion in 2023-24.
- Nationally in 2023-24, there were 81,848 police staff, 87.9% of the total were operational staff and 70.3% of the total were operational sworn police.
image to go here
Courts
Arbitrate on criminal and civil justice matters. This report focuses on administrative support functions for the courts. Judicial decisions and outcomes are not included.
- Total government recurrent expenditure on courts was $2.3 billion in 2023-24 or $86 per person in the population.
- Nationally, there were 720,335 criminal and 406,862 civil matters lodged while 716,902 criminal and 385,389 civil matters finalised in the supreme, district/county, magistrates’ and children’s courts in 2023-24.
- In the coroners’ courts, there were 29,535 lodgments and 28,366 cases finalised during 2023-24.
- In 2023-24, there were 4,325 lodgments and 4,266 finalisations in the Federal Court of Australia, 7,655 lodgments and 6,776 finalisations in the FCFCOA (Division 2, non-family law matters) and 97,961 lodgments and 99,460 finalisations in the FCFCOA (Divisions 1 and 2, family law matters).
image goes here
Corrective services
Administer correctional sanctions imposed by courts and orders of the adult parole boards through the management of adult custodial facilities and community corrections orders, and the provision of programs and services to prisoners and offenders.
- Total government recurrent expenditure on corrective services was $6.5 billion, or $242 per person in the population in 2023-24.
- Corrective services operated 113 custodial facilities nationally at 30 June 2024, comprising 86 government operated prisons, 9 privately operated prisons, 4 transitional centres, and fourteen 24-hour court cell complexes.
- On average, 43,001 people per day were held in Australian prisons during 2023-24, of which 84.0% were held in secure facilities.
- Nationally, an average of 82,627 offenders per day were serving community corrections orders in 2023-24.
Detailed information on the equity, effectiveness and efficiency of service provision and the achievement of outcomes for the Police, Courts and Corrective service areas is contained in the service-specific sections.
Government expenditure in the sector
Total government expenditure for the justice services in this report (less revenue from own sources) was almost $25.2 billion in 2023-24. For the 2022-23 financial year (the most recent financial year for which data are available across all sections), this represented around 6.2% of total government expenditure covered in this report.
Flows in the sector
For criminal matters which come to the attention of authorities, the typical flow of events is investigation by police and, if charges are laid, adjudication by courts with subsequent sentencing if applicable and possible entry into corrective services (adult prison, youth justice or community corrections orders). The roles of police, courts and corrective services, and the sequencing of their involvement, are shown in figure C.1.
C1 image goes here
Figure C.2 is an indicative model of the flows through the civil justice system. While the emphasis is on the flow of disputes which proceed to court, the role of alternative dispute resolution processes is considerable in civil justice in part as it is more available as an early alternative to court adjudication.
C2 image goes here [Drafting note: the figures for this section will remain as currently available on the website expandable option.]
Sector-wide indicators
One sector-wide proxy indicator of governments’ aim to contribute to a safe and secure community and promote a law abiding way of life is reported.
Re-offending rates
Re-offending rates show the extent to which people who have had prior contact with the criminal justice system are re-arrested or return to corrective services (either prison or community corrections). Low or decreasing rates of re-offending may indicate a safer and more secure community and the promotion of law-abiding behaviour – however higher rates may also indicate more effective policing and detection of offences.
Re-offending rates is a proxy indicator as it only reflects re‑offending that has come to the attention of authorities (some offences may go undetected by, or unreported to, police). The restricted time frames for measuring re-offending (one year for police proceedings and two years for return to corrective services) will also underestimate the true extent of repeat offending.
Re-offending is measured by:
- the proportion of people aged 10 years or over who were proceeded against more than once by police during the year
- the proportion of adults released from prison after serving a sentence who returned to corrective services (either prison or community corrections) within two years, with a new correctional sanction
- the proportion of adults discharged from community corrections orders who returned to corrective services (either prison or community corrections) with a new correctional sanction within two years.
People proceeded against by police
In each state and territory (except Western Australia, where data was not available), of people aged 10 years or over proceeded against by police in 2022-23, between 66% and 79% were proceeded against only once during the year (table CA.3). The data represent each separate occasion that police initiated a legal action against a person. Depending on the type of offence committed, police will either initiate a court action (laying of charges to be answered in court) or non-court action (which does not require a court appearance, for example warnings and penalty notices).
Adult detainees released from prison
In 2023‑24, 43.0% of prisoners released in 2021-22 after serving a sentence had returned to prison within two years. For each state and territory (except Western Australia) this only included prisoners who had returned with a new sentence within two years. For Western Australia, this also included prisoners who had returned to prison on remand within 2 years but were sentenced within 3 years. Some people returning to prison may also have received community corrections orders (figure C.3).
In 2023-24, 52.5% of released prisoners had returned to corrective services within two years (either prison or community corrections) (table CA.4). Returns to prison and corrective services were higher in all states and territories for Aboriginal and Torres Strait Islander people than non-Indigenous people (table CA.4).
Adult offenders discharged from community corrections orders
In 2023-24, 15.4% of adults discharged during 2021-22 after successfully serving orders administered by community corrections returned to community corrections within two years, and 25.0% returned to corrective services (prison or community corrections) (table CA.5).


a Does not account for all variations across Australian, state and territory governments’ criminal justice systems. b The flow diagram is indicative and does not include all complexities of the criminal justice system. c Ex officio indictment refers to a decision by the Director of Public Prosecutions (DPP) to commence criminal proceedings in a higher court without a committal hearing, or where a committal hearing did not result in a case being committed to trial in a higher court.
Figure C.2 is an indicative model of the flows through the civil justice system. While the emphasis is on the flow of disputes which proceed to court, the role of alternative dispute resolution processes is considerable in civil justice in part as it is more available as an early alternative to court adjudication.
Figure C.2 Flows through the civil justice system a, b
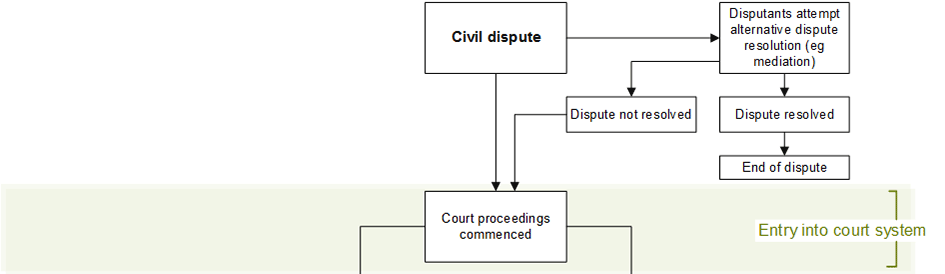


a Does not account for all variations across Australian, state and territory governments’ civil justice systems. b The flow diagram is indicative and does not include all complexities of the civil justice system.
Sector-wide indicators
One sector-wide proxy indicator of governments’ aim to contribute to a safe and secure community and promote a law abiding way of life is reported.
Re-offending rates
Re-offending rates show the extent to which people who have had contact with the criminal justice system are re-arrested or return to corrective services (either prison or community corrections). Low or decreasing rates of re-offending may indicate a safer and more secure community environment and the promotion of a more law-abiding way of life – however higher rates may also indicate more effective policing and detection of offences.
Re-offending rates is a proxy indicator as it only reflects those people whose re‑offending has come to the attention of authorities (some offences may go undetected by, or unreported to, police). The restricted time frames for measuring re-offending (one year for police proceedings and two years for return to corrective services) will also underestimate the proportions of offenders who have repeat contact with the criminal justice system beyond those time frames.
Re-offending is measured by:
- the proportion of people aged 10 years or over who were proceeded against more than once by police during the year
- the proportion of adults released from prison after serving a sentence who returned to corrective services (either prison or community corrections) within two years, with a new correctional sanction
- the proportion of adults discharged from community corrections orders who returned to corrective services (either prison or community corrections) with a new correctional sanction within two years.
People proceeded against by police
In each state and territory (except Western Australia, where data was not available), of people aged 10 years or over proceeded against by police in 2022-23, between 66% and 79% were proceeded against only once during the year (table CA.3). The data represent each separate occasion that police initiated a legal action against a person. Depending on the type of offence committed, police will either initiate a court action (laying of charges to be answered in court) or non-court action (which does not require a court appearance, for example warnings and penalty notices).
Adult offenders released from prison
In 2023‑24, 43.0% of prisoners released in 2021-22 after serving a sentence had returned to prison within two years (for New South Wales, Victoria, Queensland, South Australia, Tasmania and the Northern Territory this only included prisoners who had returned with a new sentence within two years, for Western Australia and the Australian Capital Territory this also included prisoners who had returned to prison on remand within 2 years but were sentenced within 3 years). Some people returning to prison may also have received community corrections orders (figure C.3). In total, 52.5% of released prisoners had returned to corrective services within two years in 2023-24 (either prison or community corrections) (table CA.4). Returns to prison and corrective services were higher in all states and territories for Aboriginal and Torres Strait Islander people than non-Indigenous people (table CA.4).
Adult offenders discharged from community corrections orders
In 2023-24, 15.4% of adults discharged during 2021‑22 after serving orders administered by community corrections returned to community corrections within two years, and 25.0% returned to corrective services (prison or community corrections) (table CA.5).
We value your comments about this publication and encourage you to provide feedback.