WORKING GROUP DRAFT – IN CONFIDENCEReport on Government Services 2026
PART E, SECTION 12: RELEASED ON 5 FEBRUARY 2026
12 Public hospitals
This section reports on the performance of governments in providing public hospitals, with a focus on acute care services.
The Indicator results tab uses data from the data tables to provide information on the performance for each indicator in the Indicator framework. The same data is also available in CSV format.
Data downloads
![]() 12 Public hospitals data tables (XLSX 943.8 KB)
12 Public hospitals data tables (XLSX 943.8 KB)
![]() 12 Public hospitals dataset (CSV 3.5 MB)
12 Public hospitals dataset (CSV 3.5 MB)
Refer to the corresponding table number in the data tables for detailed definitions, caveats, footnotes and data source(s).
Objectives for public hospitals
Public hospitals aim to alleviate or manage illness and the effects of injury by providing acute, non and sub-acute care along with emergency and outpatient care that is:
- timely and accessible to all
- appropriate and responsive to the needs of individuals throughout their lifespan and communities
- high quality and safe
- well coordinated to ensure continuity of care where more than one service type, and/or ongoing service provision is required
- sustainable.
Governments aim for public hospital services to meet these objectives in an equitable and efficient manner.
Public hospitals provide a range of services, including:
- acute care services to admitted patients
- sub‑acute and non‑acute services to admitted patients (for example, rehabilitation, palliative care and long stay maintenance care)
- emergency, outpatient and other services to non‑admitted patients
- mental health services, including services provided to admitted patients by designated psychiatric/psychogeriatric units
- public health services
- teaching and research activities.
This section focuses on services (acute, subacute and non‑acute) provided to admitted patients and services provided to non‑admitted patients in public hospitals. These services comprise the bulk of public hospital activity.
In some instances, data for stand‑alone psychiatric hospitals are included in this section. The performance of psychiatric hospitals and psychiatric units of public hospitals is examined more closely in the ‘Services for mental health’ section of this report (section 13).
Total recurrent expenditure on public hospitals (excluding depreciation) was $96.1 billion in 2022‑23 (table 12A.1), with 94% funded by the Australian, state and territory governments and 6% funded by non‑government sources (including depreciation) (Australian Institute of Health and Welfare 2024a).
Government real recurrent expenditure (all sources) on public hospitals per person was $3,649 in 2022‑23; an increase of 1% from 2021‑22 ($3,616) (table 12A.2).
Hospitals
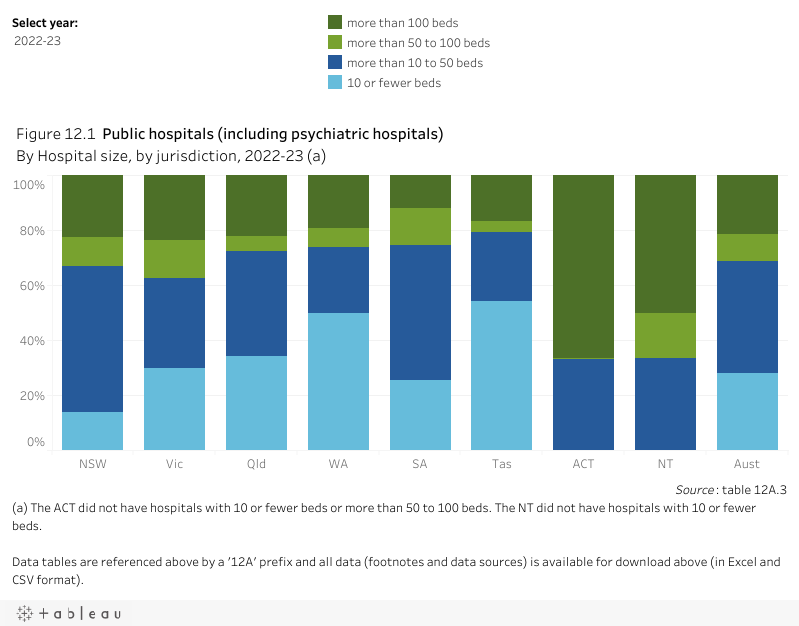
In 2022‑23, there were 700 public hospitals in Australia – three more, overall, than in 2021‑22 (table 12A.3). Although 68.6% of hospitals had 50 or fewer beds (figure 12.1), these smaller hospitals represented only 12.1% of total available beds (table 12A.3).
Hospital beds
There were 65,051 public hospital beds available for admitted patients in public hospitals in 2022‑23, equivalent to 2.5 beds per 1,000 people (table 12.1 and tables 12A.3–4). Information on the availability of hospital beds in relation to the population provides some information about the accessibility of public hospital services. However, the concept of an available bed is becoming less important in the overall context of hospital activity, particularly given the extent to which hospitals provide services for patients who usually reside in other areas of the state or territory, in other jurisdictions, or who receive services through different modes of care (such as virtual care or ‘hospital in the home’ care models) (AIHW 2024b). Nationally, the number of beds available per 1,000 people increased as remoteness increased (table 12A.4). The patterns of bed availability across regions may reflect the availability of other health‑care services and patterns of disease and injury (AIHW 2024c).

Admitted patient care
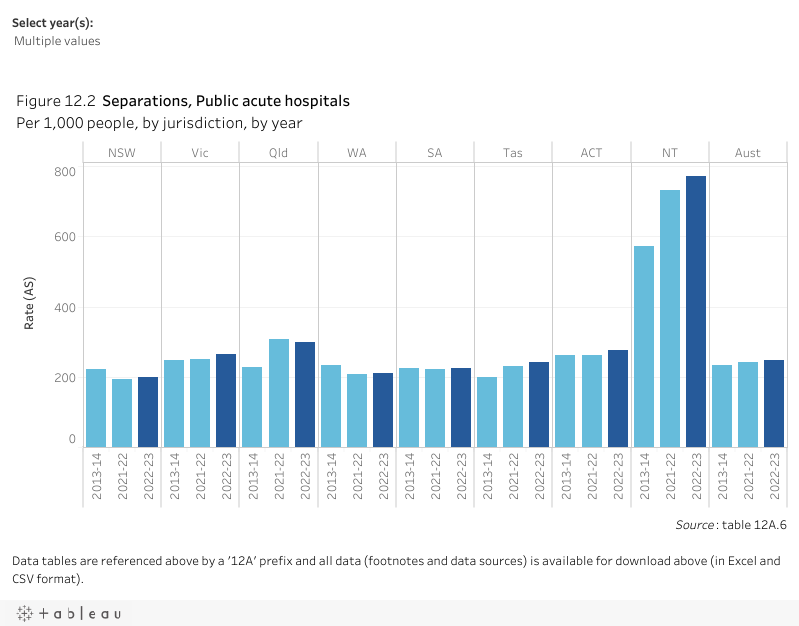
There were approximately 7.1 million separations from public (non‑psychiatric) hospitals in 2022‑23, of which over half (56.1%) were same day patients (table 12A.5). Nationally, this equates to 246.8 separations per 1,000 people (figure 12.2). Acute care separations accounted for 94.1% of separations from public hospitals (table 12A.10).
Variations in admission rates can reflect different practices in classifying patients as either admitted same day patients or non‑admitted outpatients. The extent of differences in classification practices can be inferred from the variation in the proportion of same day separations across jurisdictions for certain conditions or treatments. This is particularly true of medical separations, where there was significant variation across jurisdictions in the proportion of same day medical separations in 2022‑23 (table 12A.7).
In 2022-23, on an age‑standardised basis, public hospital separation rates for Aboriginal and Torres Strait Islander people were markedly higher than the corresponding rates for all people. For private hospital separations, rates were higher for all people compared to Aboriginal and Torres Strait Islander people (though separations are lower for private hospitals compared to public hospitals) (table 12A.8).
Non-admitted patient services
Non-admitted patient services include outpatient services, which may be provided on an individual or group basis, and emergency department services. Nationally in 2022‑23, 41.1 million non‑admitted patient care service events were provided for public patients, 25.8% less than in 2021-22 (55.4 million) (table 12A.11). Of these, 38.2 million individual service events were provided to outpatients in public hospitals (a 27.9% decrease from 2021‑22) and 849,029 group service events were provided (a 24.8% increase on 2021‑22). Differing admission practices across states and territories lead to variation among jurisdictions in the services reported (AIHW 2024d).
There were 9,018,401 presentations to emergency departments in 2023‑24 (table 12A.12).
Staff
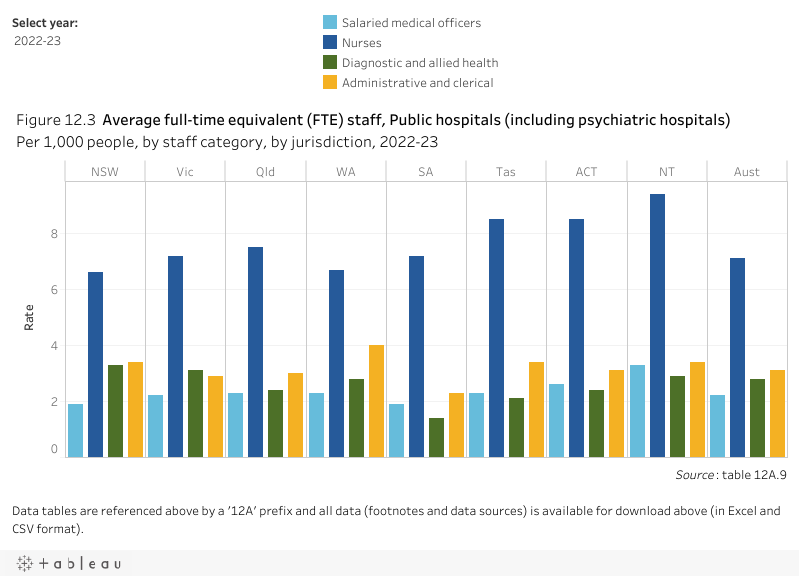
In 2022-23, nurses comprised the single largest group of full‑time equivalent (FTE) staff employed in public hospitals (figure 12.3). Comparing data on FTE staff across jurisdictions should be undertaken with care, as this data is affected by jurisdictional differences in recording and classifying staff.
The performance indicator framework provides information on equity, effectiveness and efficiency, and distinguishes the outputs and outcomes of public hospital services.
The performance indicator framework shows which data is complete and comparable in this report. For data that is not considered directly comparable, text includes relevant caveats and supporting commentary. Section 1 discusses data comparability and completeness from a report‑wide perspective. In addition to the contextual information for this service area (refer to Context tab), the report’s statistical context (section 2) contains data that may assist in interpreting the performance indicators presented in this section.
Improvements to performance reporting for public hospital services are ongoing and include identifying data sources to fill gaps in reporting for performance indicators and measures, and improving the comparability and completeness of data.
Outputs
Outputs are the services delivered (while outcomes are the impact of these services on the status of an individual or group) (refer to section 1). Output information is also critical for equitable, efficient and effective management of government services.
Outcomes
Outcomes are the impact of services on the status of an individual or group (refer to section 1).
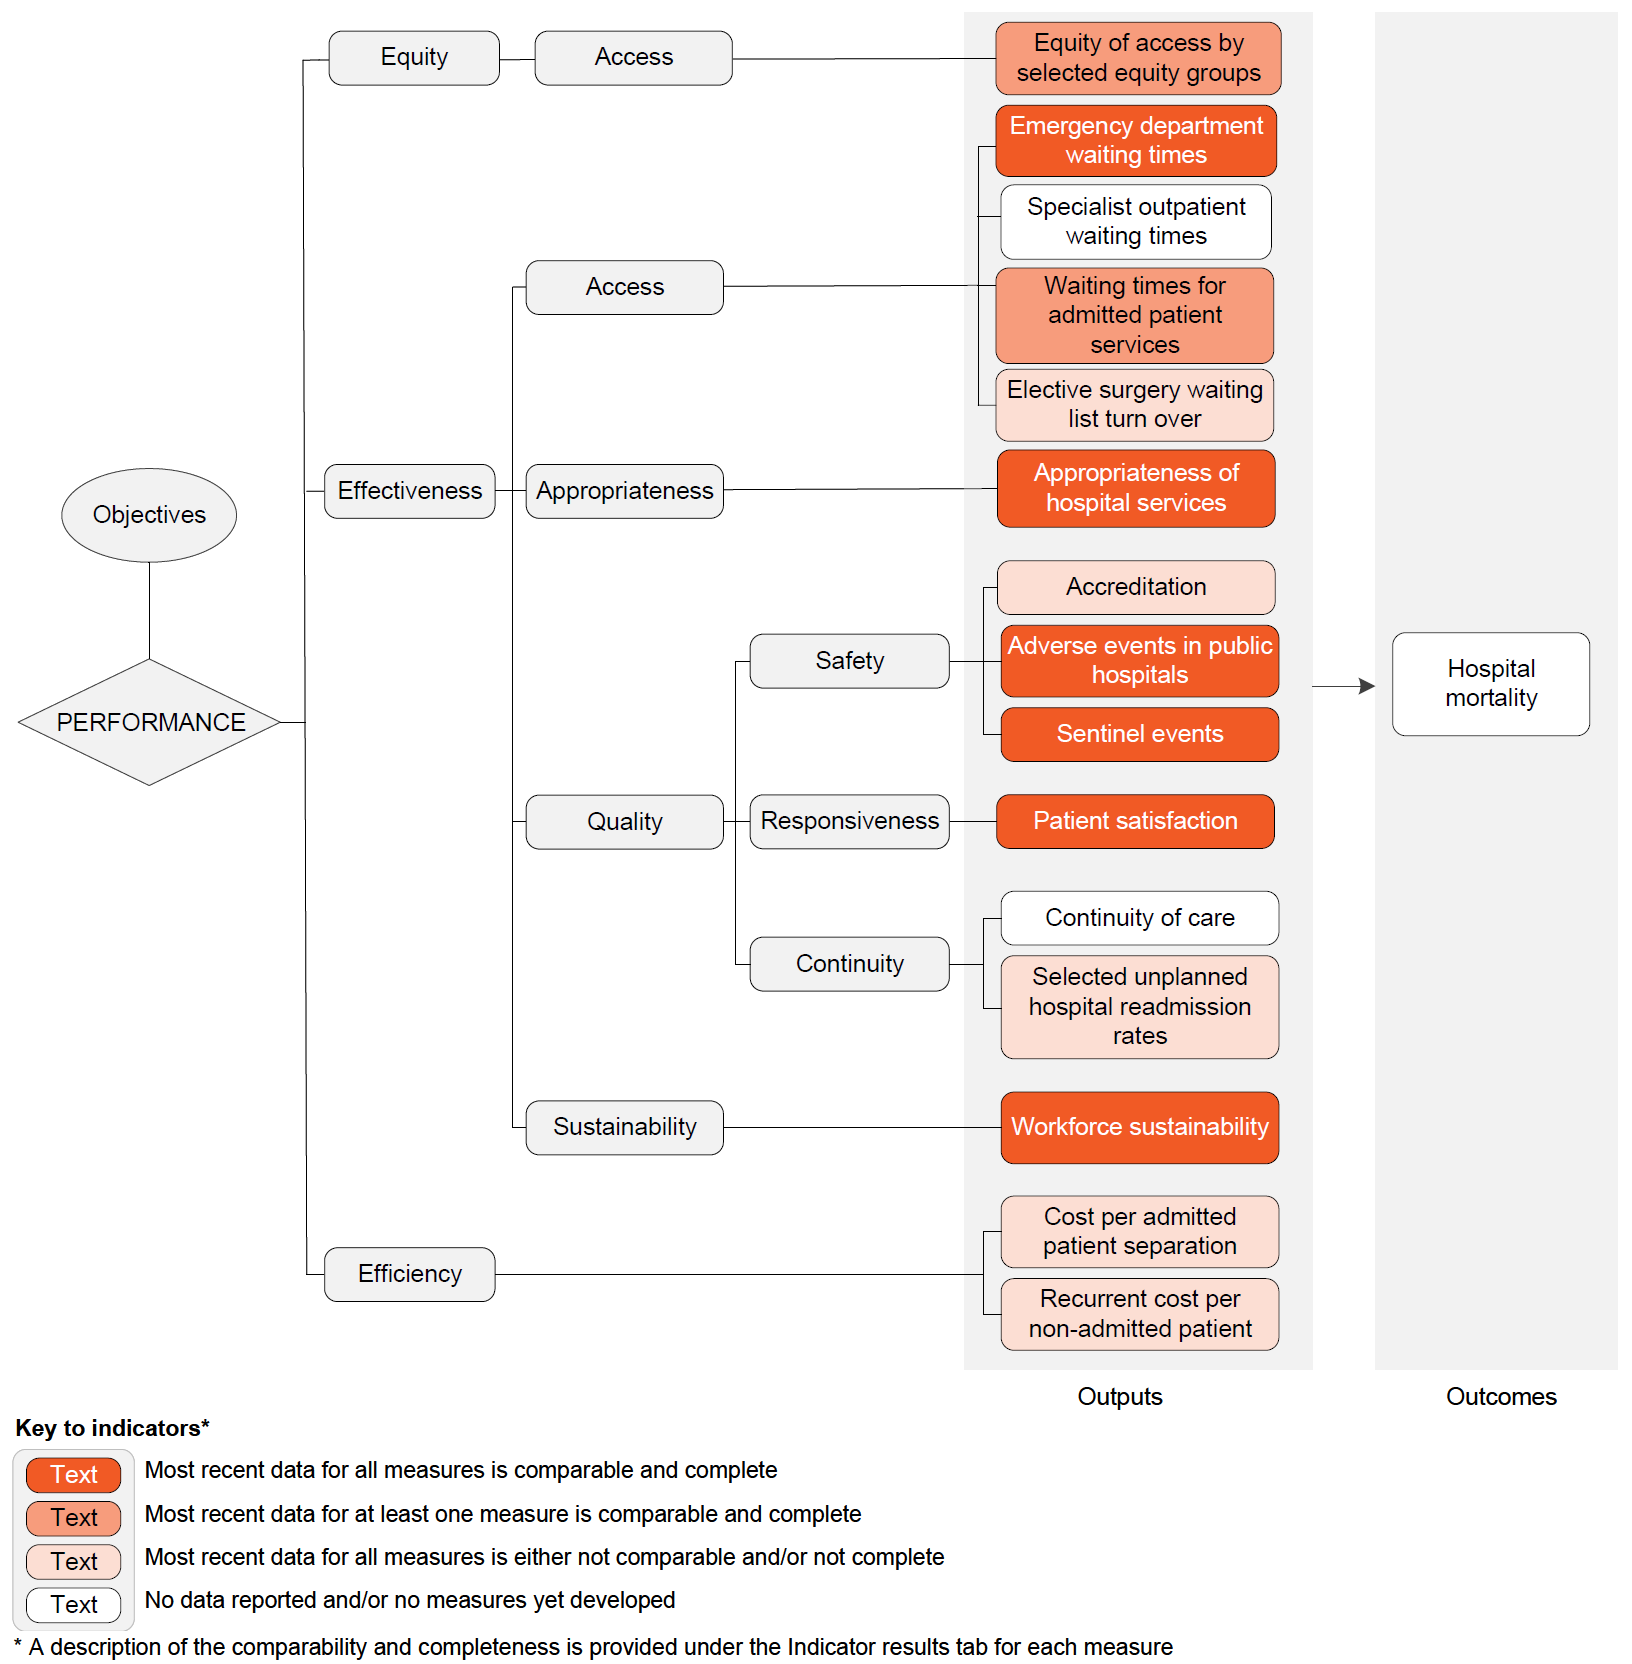
Performance – linked to Objectives
Outputs
Equity – Access
- Equity of access by selected equity groups – most recent data for at least one measure is comparable and complete
Effectiveness – Access
- Emergency department waiting times – most recent data for all measures is comparable and complete
- Specialist outpatient waiting times – no data reported and/or no measures yet developed
- Waiting times for admitted patient services – most recent data for at least one measure is comparable and complete
- Elective surgery waiting list turn over – most recent data for all measures is either not comparable and/or not complete
Effectiveness – Appropriateness
- Appropriateness of hospital services – most recent data for all measures is comparable and complete
Effectiveness – Quality – Safety
- Accreditation – most recent data for all measures is either not comparable and/or not complete
- Adverse events in public hospitals – most recent data for all measures is comparable and complete
- Sentinel events – most recent data for all measures is comparable and complete
Effectiveness – Quality – Responsiveness
- Patient satisfaction – most recent data for all measures is comparable and complete
Effectiveness – Quality – Continuity
- Continuity of care – no data reported and/or no measures yet developed
- Selected unplanned hospital readmission rates – most recent data for all measures is either not comparable and/or not complete
Effectiveness – Sustainability
- Workforce sustainability – most recent data for all measures is comparable and complete
Efficiency
- Cost per admitted patient separation – most recent data for all measures is either not comparable and/or not complete
- Recurrent cost per non‑admitted patient – most recent data for all measures is either not comparable and/or not complete
Outcomes
- Hospital mortality – no data reported and/or no measures yet developed
A description of the comparability and completeness is provided under the Indicator results tab for each measure.
This section presents an overview of 'Public hospital services' performance indicator results. Different delivery contexts, locations and types of clients can affect the equity, effectiveness and efficiency of public hospital services.
Information to assist the interpretation of this data can be found with the indicators below and all data (footnotes and data sources) is available for download above as an excel spreadsheet and as a CSV dataset. Data tables are identified by a ‘12A’ prefix (for example, table 12A.1).
Specific data used in figures can be downloaded by clicking in the figure area, navigating to the bottom of the visualisation to the grey toolbar, clicking on the 'Download' icon and selecting 'Data' from the menu. Selecting 'PDF' or 'Powerpoint' from the 'Download' menu will download a static view of the performance indicator results.
‘Equity of access by selected equity groups’ is an indicator of governments’ objective to provide hospital services in an equitable manner. 'Equity of access by selected equity groups' is defined by three measures:
- Emergency department waiting times by triage category, defined as the proportion of patients seen within the benchmarks set by the Australasian Triage Scale
- Presentations to public hospital emergency departments where the time from presentation to admission, transfer or discharge is less than or equal to four hours
- Overall elective surgery waiting times.
The measures are disaggregations of existing emergency department and elective surgery waiting times indicators. Selected equity groups include people:
- who are Aboriginal and Torres Strait Islander
- from regional and remote areas (based on the ABS Australian Statistical Geography Standard remoteness area structure)
- from low socio-economic areas (based on the ABS Index of Relative Socio‑economic Disadvantage, with quintile 1 being the most disadvantaged and quintile 5 being the least disadvantaged).
Results for this indicator should be interpreted with caution:
- Refer to PI 2 'Emergency department waiting times’ for further information on the Australasian Triage Scale and triage categories.
- Refer to PI 4 ‘Waiting times for admitted patient services’ for further information on the scope and calculation of presentations to emergency departments with a length of stay of 4 hours or less ending in admission, overall elective surgery waiting times and elective surgery waiting times by clinical urgency category.
- Refer to PI 5 'Elective surgery waiting list turn over'. This indicator reports the number of additions to, and removals from, public hospital elective surgery waiting lists. Waiting list turn over data is relevant to understanding the extent to which public hospitals are keeping pace with demand for elective surgery.
- Refer to PI 6 ‘Appropriateness of hospital services’. This indicator reports the extent to which emergency department and admitted patients did not wait, left at own risk and discharged against medical advice, rates of which are consistently higher for Aboriginal and Torres Strait Islander people than non‑Indigenous people.
This indicator does not provide information on whether the services are appropriate for the needs of the people receiving them, or correctly targeted to those most in need.
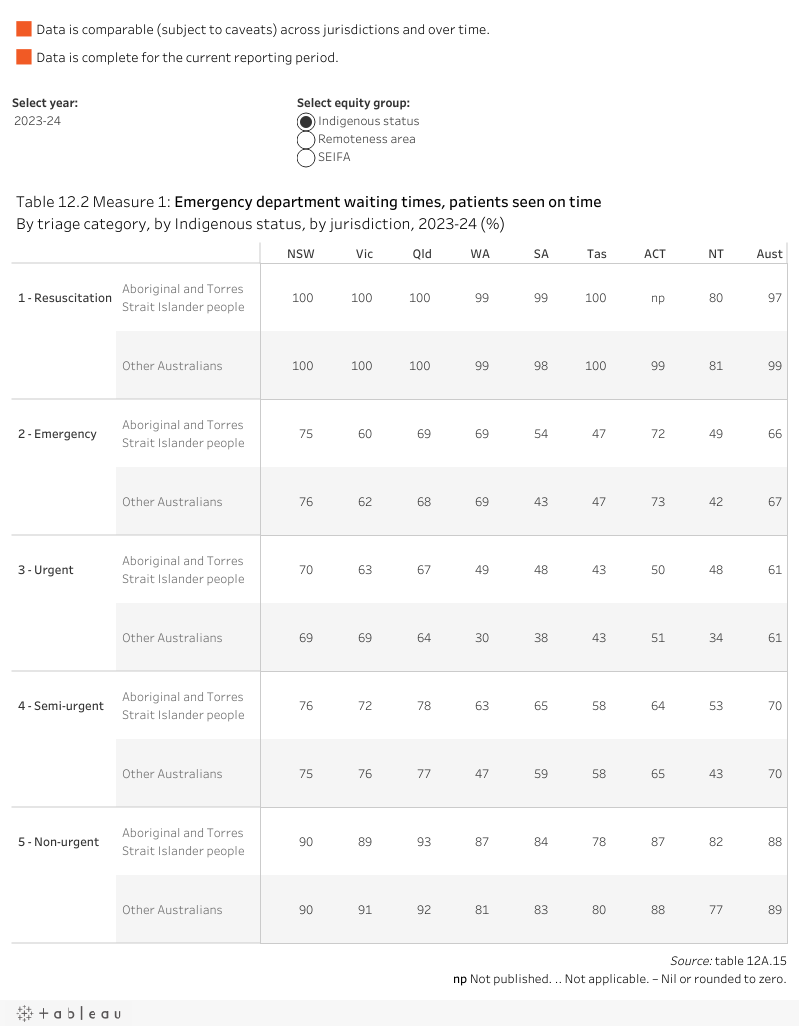
Measure 1: In 2023-24, all category 1 Aboriginal and Torres Strait Islander patients were seen within clinically appropriate timeframes, except in Western Australia, South Australia and the Northern Territory. Data for the Australian Capital Territory was not published. These results are similar to the results observed for other Australians. Proportions were similar for category 1 patients across remoteness categories and socio‑economic areas (table 12.2 and tables 12A.14–17).
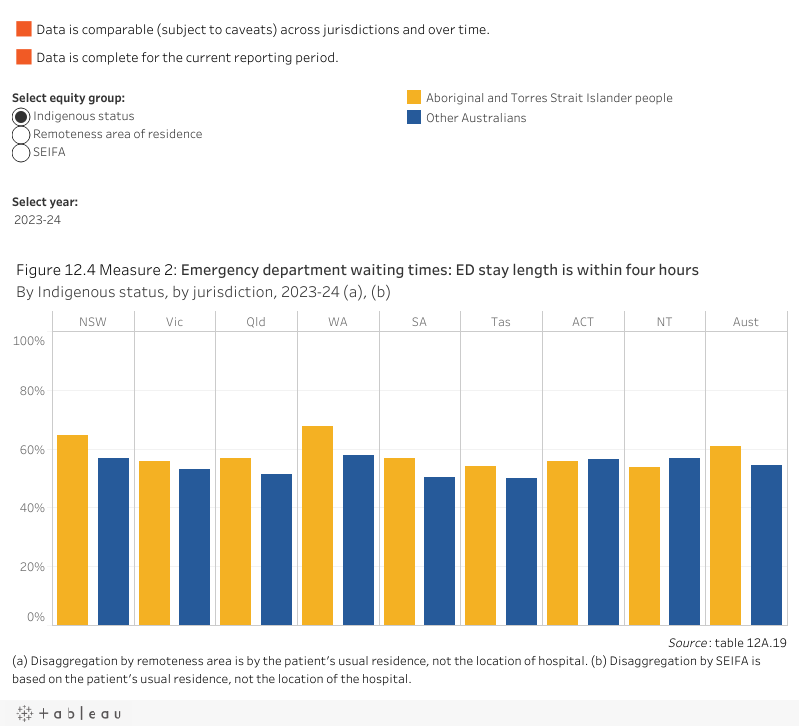
Measure 2: Nationally, in 2023-24, the proportion of patients with a length of stay in an emergency department of four hours or less was:
- higher for Aboriginal and Torres Strait Islander patients than other Australians
- higher for patients in outer regional, remote and very remote areas compared to inner regional and major cities
- similar for patients across socio‑economic areas (figure 12.4) (tables 12A.19–21).
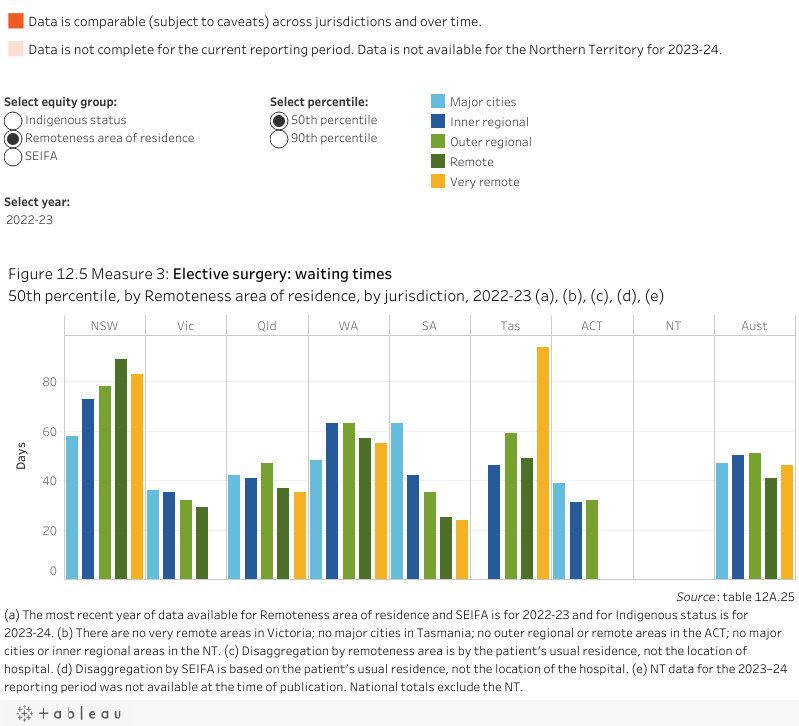
Measure 3: Nationally (excluding the Northern Territory), in 2022-23, the time within which 50% of patients were admitted for their awaited procedure varied by remoteness area from 51 days for people in outer regional areas to 41 days for people in remote areas. The time within which 50% of patients were admitted across socio‑economic areas ranged from 40 days for people in the highest socio‑economic status area to 51 days for people in the lowest socio‑economic status area. More recent data (2023-24) is available by Indigenous status (except for the Northern Territory). In 2023-24, overall, the time within which 50% of Aboriginal and Torres Strait Islander people were admitted for their awaited procedure was greater than that for other Australians (56 days and 46 days, respectively) (figure 12.5 and tables 12A.24–26).
‘Emergency department waiting times’ is an indicator of governments’ objective to provide timely and accessible services to all.
‘Emergency department waiting times’ is defined by the following two measures:
- Emergency department waiting times by triage category, defined as the proportion of patients seen within the benchmarks set by the Australasian Triage Scale. The Australasian Triage Scale is a scale for rating clinical urgency, designed for use in hospital-based emergency services in Australia and New Zealand. The benchmarks, set according to triage category, are as follows:
- triage category 1: need for resuscitation – patients seen immediately
- triage category 2: emergency – patients seen within 10 minutes
- triage category 3: urgent – patients seen within 30 minutes
- triage category 4: semi-urgent – patients seen within 60 minutes
- triage category 5: non-urgent – patients seen within 120 minutes.
- Proportion of patients staying for four hours or less, defined as the proportion of presentations to public hospital emergency departments where the time from presentation to admission, transfer or discharge is less than or equal to four hours. It is a measure of the duration of the emergency department service rather than a waiting time for emergency department care.
High or increasing proportions for both measures are desirable.
The comparability of emergency department waiting times data across jurisdictions can be influenced by differences in data coverage and clinical practices – in particular, the allocation of cases to urgency categories. The proportion of patients in each triage category who were subsequently admitted can indicate the comparability of triage categorisations across jurisdictions and thus the comparability of the waiting times data (table 12A.13).
Measure 1: In 2023-24, all category 1 patients were seen within clinically appropriate timeframes in New South Wales, Victoria, Queensland and Tasmania, but not in Western Australia, South Australia, the Australian Capital Territory or the Northern Territory. For all triage categories combined, an estimated 67% of patients were seen within triage category timeframes (table 12.3).
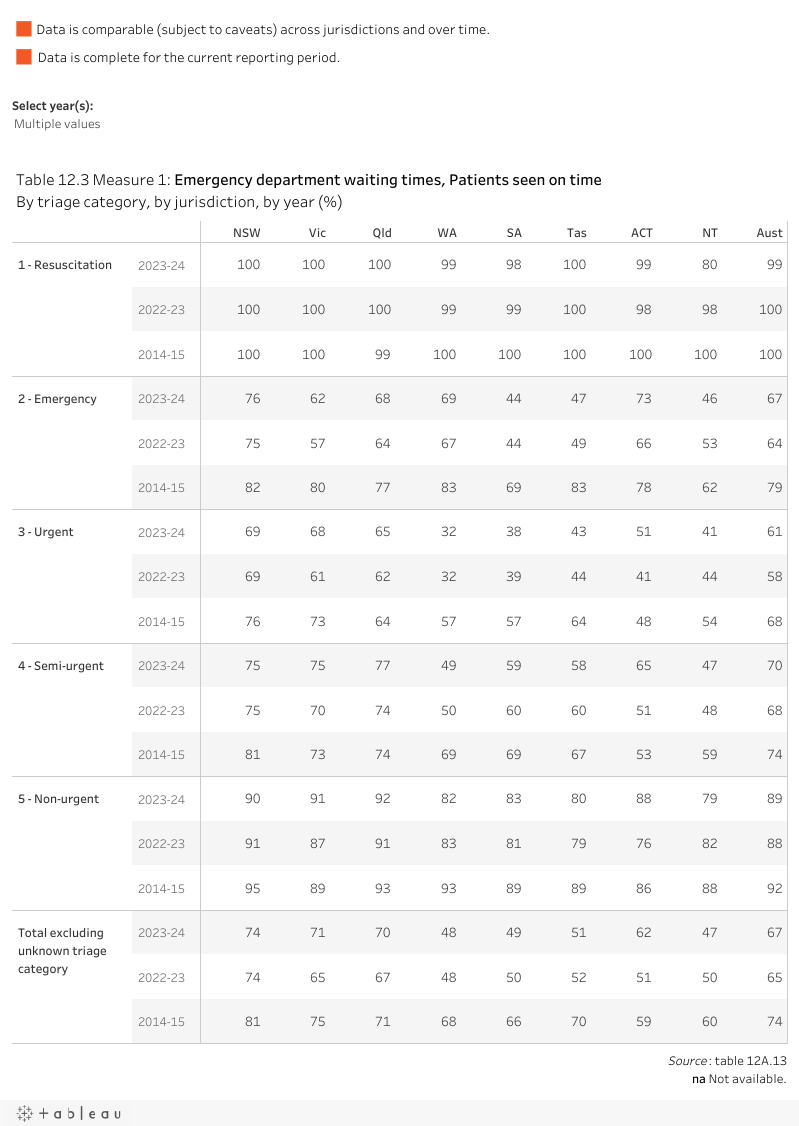
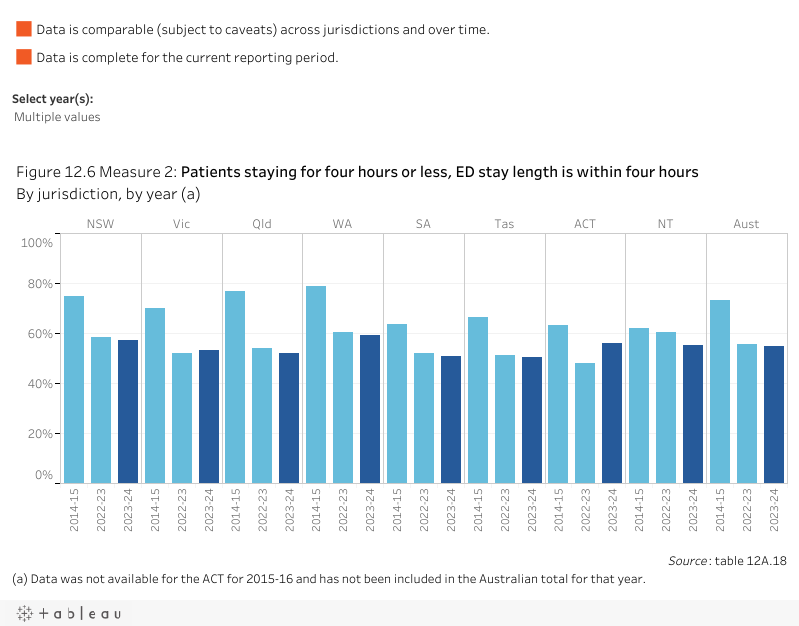
Measure 2: Nationally in 2023-24, the proportion of patients staying for four hours or less in an emergency department was 55.0%, continuing an annual decrease from 73.2% in 2014‑15 (figure 12.6).
‘Specialist outpatient waiting times’ is an indicator of governments’ objective to provide timely and accessible hospital services.
‘Specialist outpatient waiting times’ are defined as the period of time (days or months) between the date a specialist outpatient clinic receives a patient referral, and the date that patient is first seen by the specialist outpatient clinic.
A low or decreasing number of days waited is desirable.
This indicator is currently under development for reporting in the future.
Local approaches to measuring and reporting on specialist outpatient waiting times are shown in table 12.4:
| Vic | Victoria reports quarterly on the waiting time for a routine first specialist clinic appointment (number of days between the date a specialist clinic receives a routine patient referral, and the date the patient is first seen by the specialist clinic) at the 50th and 90th percentile, disaggregated by medical specialty. Data are also reported on the proportion of routine patients who were seen by the specialist clinic within the recommended time of 365 days from receiving the referral. A routine first appointment is where a patient has been referred to a specialist clinic and the clinician determines the patient should be seen within 365 days from the date the referral was received (non-urgent patients who do not need to be seen by a specialist clinic within 30 days). A specialist clinic is a unit within a hospital that provides planned, non-admitted services. First appointment data is recorded when a first appointment is booked, even if the patient does not attend. Once referred to a specialist clinic by a GP or other health provider, a patient can only have one first appointment. This is recorded at the specialist clinic to which they were referred. https://vahi.vic.gov.au/specialist-clinics/routine-first-appointments |
|---|---|
| Qld | Queensland reports publicly on:
The start of the waiting time is the date a referral was received by the treating hospital. The end of the waiting time is the appointment date (for the 90th percentile wait) or the census date (for the percentage waiting within time). The number of days between the start and the end of the waiting time is calculated first. Then excluded from this total is any days the patient was not ready for care and any days the patient was waiting as a less urgent category and any days the referral could not progress because the hospital was waiting further information from the referring practitioner. If a patient is offered an appointment and they cancel, or fail to show up for the appointment, their wait continues. An 'initial service event' is the first appointment a patient has with the health professional in an outpatient clinic, for treatment or management of the condition for which they have been referred. When a patient has had their initial service event, they are no longer on the waiting list for that service. http://www.performance.health.qld.gov.au/Hospital/SpecialistOutpatient/99999 |
| SA | South Australia reports publicly on the median and maximum waiting times (months) for reported specialist clinics in metropolitan hospitals for patients that are routine (Category 2) or non-urgent (Category 3) or are on a waiting list and have not been given an appointment, by outpatient specialty. These patients are considered ‘unscheduled’. All urgent (category 1) patients are given an appointment and are therefore not added to the outpatient waiting list. The median waiting times are considered a more accurate measure because some people will have very short waiting times or very long waiting times, and this can make the average measure less representative of the time most people wait for an appointment. In most cases, the maximum waiting time represents the time one individual patient has waited as at the date of the Report. SA Health has several patient administration systems that have different reporting capabilities for outpatient waiting list information. As a result, the quality, accuracy, and consistency of outpatient data is a significant challenge. SA Health is continuing to undertake initiatives which improve the quality, reliability, and availability of information. |
| Tas | Tasmania publicly reports indicative 75th percentile waiting times (in days), by region (Southern, North West and Northern Regions), specialty type, and urgency category (Urgent condition, Semi‑Urgent condition and Non-urgent condition). https://www.health.tas.gov.au/hospitals/outpatients/wait_times |
Sources: State and Territory governments (unpublished).
‘Waiting times for admitted patient services’ is an indicator of governments’ objective to provide timely and accessible services to all.
‘Waiting times for admitted patient services’ is defined by the following three measures:
- Overall elective surgery waiting times
- Elective surgery waiting times by clinical urgency category
- Presentations to emergency departments with a length of stay of four hours or less ending in admission.
Overall elective surgery waiting times
‘Overall elective surgery waiting times’ are calculated by comparing the date patients are added to a waiting list with the date they were admitted. Days on which the patient was not ready for care are excluded. Overall waiting times are presented as the number of days within which 50% of patients are admitted and the number of days within which 90% of patients are admitted. Patients on waiting lists who were not subsequently admitted are excluded.
For overall elective surgery waiting times, a low or decreasing number of days waited is desirable. Comparisons across jurisdictions should be made with caution, due to differences in clinical practices and classification of patients across Australia. The measures are also affected by variations across jurisdictions in the method used to calculate waiting times for patients who transferred from a waiting list managed by one hospital to a waiting list managed by another hospital, with the time waited on the first list included in the waiting time reported in New South Wales, Western Australia, South Australia and the Northern Territory. This approach can have the effect of increasing the apparent waiting times for admissions in these jurisdictions compared with other jurisdictions.
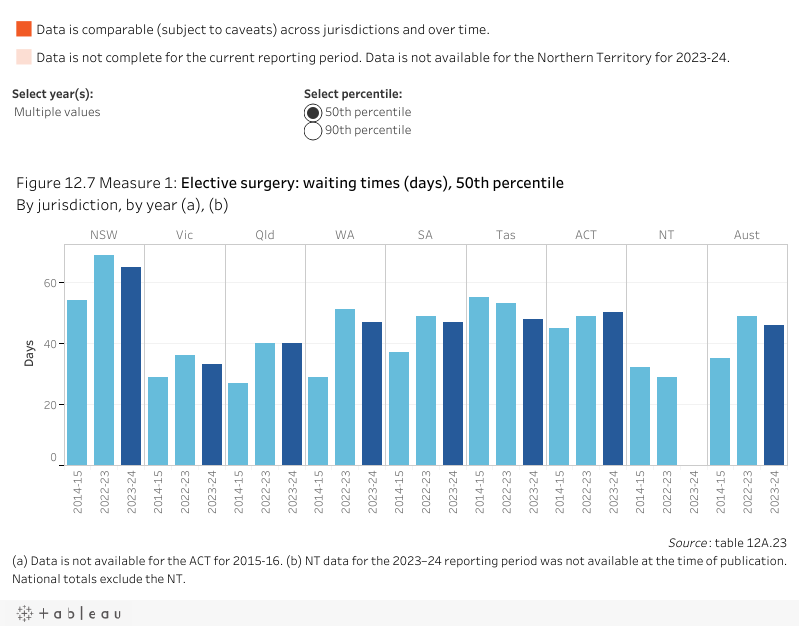
Measure 1: Nationally (excluding the Northern Territory), in 2023-24, 50% of patients were admitted within 46 days (down from 49 days in 2022-23) and 90% of patients were admitted within 329 days (down from 361 days in 2022‑23) (figure 12.7). Data is available on elective surgery waiting times by hospital peer group and procedure, by Aboriginal and Torres Strait Islander status, remoteness area of residence and socio‑economic status (tables 12A.23–26).
Elective surgery waiting times by clinical urgency category
‘Elective surgery waiting times by clinical urgency category’ reports the proportion of patients who were admitted from waiting lists after an extended wait. When patients are placed on public hospital waiting lists, clinical assessments are made on how urgently they require elective surgery. The clinical urgency categories are:
- Category 1 – procedures that are clinically indicated within 30 days
- Category 2 – procedures that are clinically indicated within 90 days
- Category 3 – procedures that are clinically indicated within 365 days.
The term ‘extended wait’ is used for patients in categories 1, 2 and 3 waiting longer than specified times (30 days, 90 days and 365 days respectively).
For elective surgery waiting times by clinical urgency category, a low or decreasing proportion of patients who experienced extended waits at admission is desirable. However, variation in the way patients are classified to urgency categories should be considered. Rather than comparing jurisdictions, the results for individual jurisdictions should be viewed in the context of the proportions of patients assigned to each of the three urgency categories.
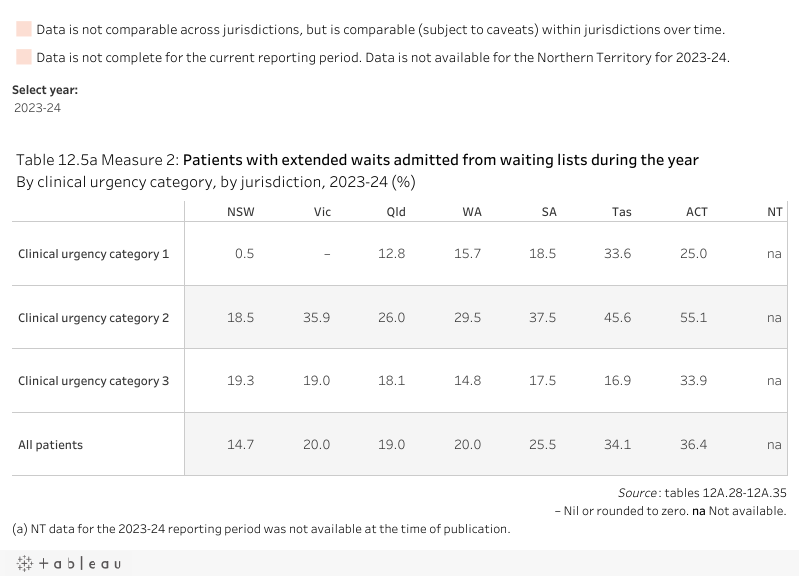
Measure 2: Jurisdictional differences in the classification of patients by urgency category are shown in table 12.5a. The proportions of patients on waiting lists who already had an extended wait at the date of assessment are reported in tables 12A.28–35.
Presentations to emergency departments with a length of stay of four hours or less ending in admission
‘Presentations to emergency departments with a length of stay of four hours or less ending in admission’ is defined as the proportion of presentations to public hospital emergency departments where the time from presentation to admission to hospital is less than or equal to four hours.
A high or increasing proportion of presentations to emergency departments with a length of stay of four hours or less ending in admission is desirable.
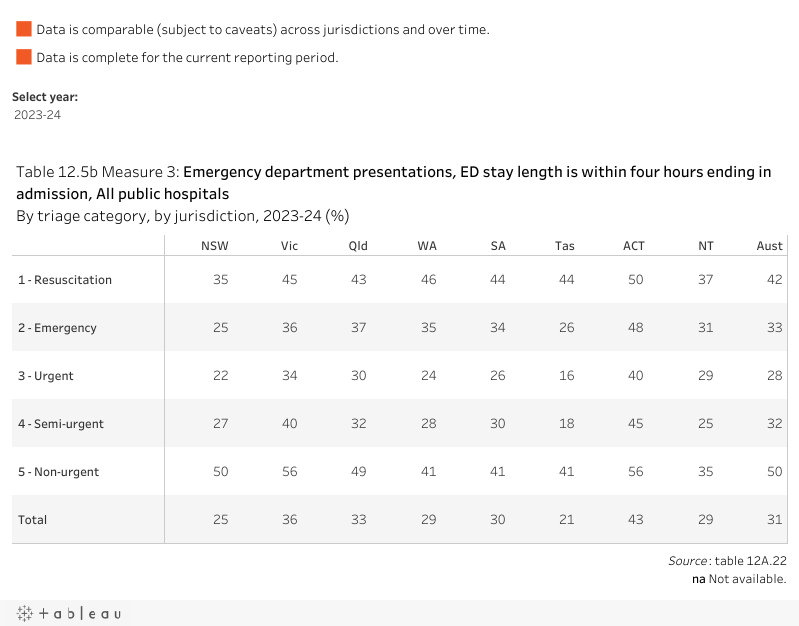
Measure 3: Nationally in 2023-24, 31% of people who presented to an emergency department and were admitted, waited four hours or less to be admitted to a public hospital (table 12.5b). This proportion was the same in 2022‑23 after declining from 46% in 2019-20.
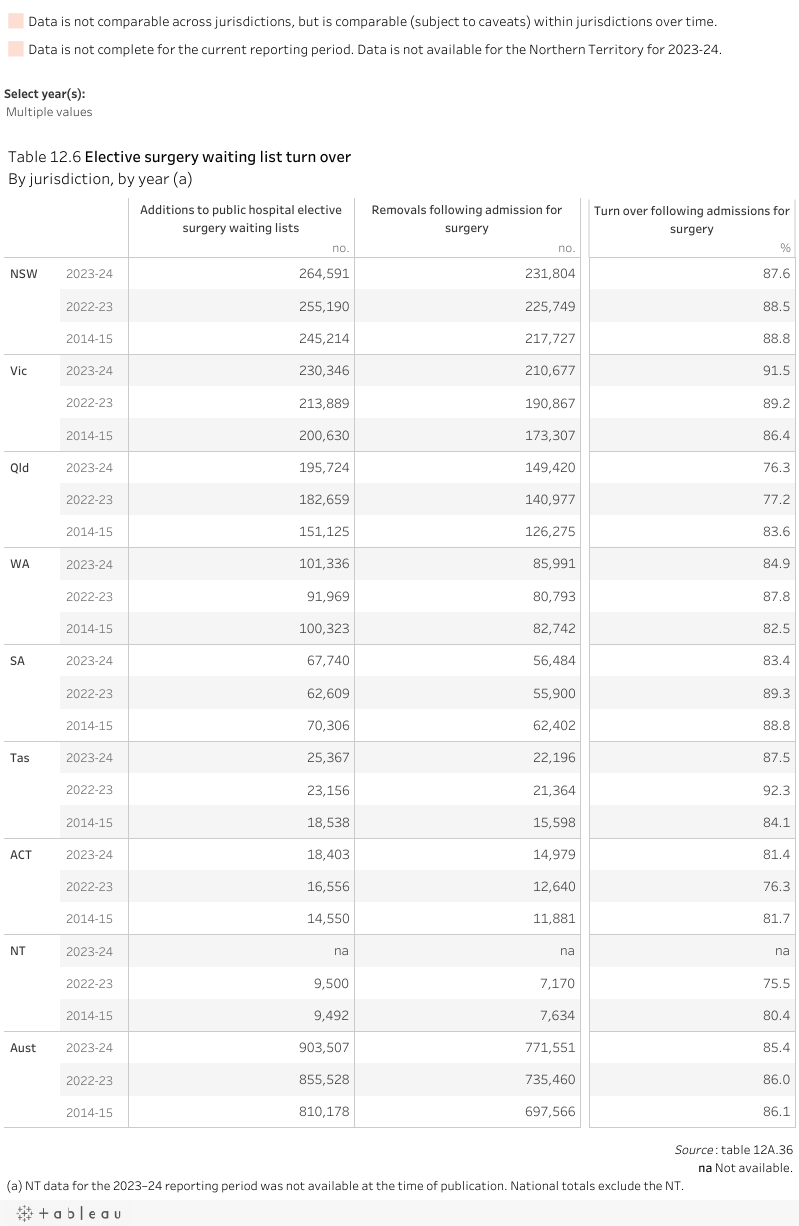
‘Elective surgery waiting list turn over’ is an indicator of governments' objective to provide timely and accessible services to all.
‘Elective surgery waiting list turn over’ is defined as the number of additions to, and removals from, public hospital elective surgery waiting lists. It is measured as the number of people removed from public hospital elective surgery waiting lists following admission for surgery during the reference year, divided by the number of people added to public hospital elective surgery waiting lists during the same year, multiplied by 100.
The number of people removed from public hospital elective surgery waiting lists following admission for surgery includes elective and emergency admissions. For context, the total number of removals from elective surgery waiting lists are also reported. Other reasons for removal include patient not contactable or died, patient treated elsewhere, surgery not required or declined, transferred to another hospital's waiting list, and not reported.
When interpreting this data, 100% indicates that an equal number of patients were added to public hospital elective surgery waiting lists as were removed following admission for surgery during the reporting period (therefore the number of patients on the waiting list will be largely unchanged). A figure less than 100% indicates that more patients were added to public hospital elective surgery waiting lists than were removed following admission for surgery during the reporting period (therefore the number of patients on the waiting list will have increased).
A higher and increasing proportion of patient turnover is desirable as it indicates the public hospital system is keeping pace with demand for elective surgery.
Nationally (excluding the Northern Territory) in 2023-24, 903,507 people were added to public hospital elective surgery waiting lists, while 771,551 people were removed following admission for surgery, resulting in a national public hospital elective surgery waiting list turnover of 85.4% (table 12.6). Results varied across jurisdictions.
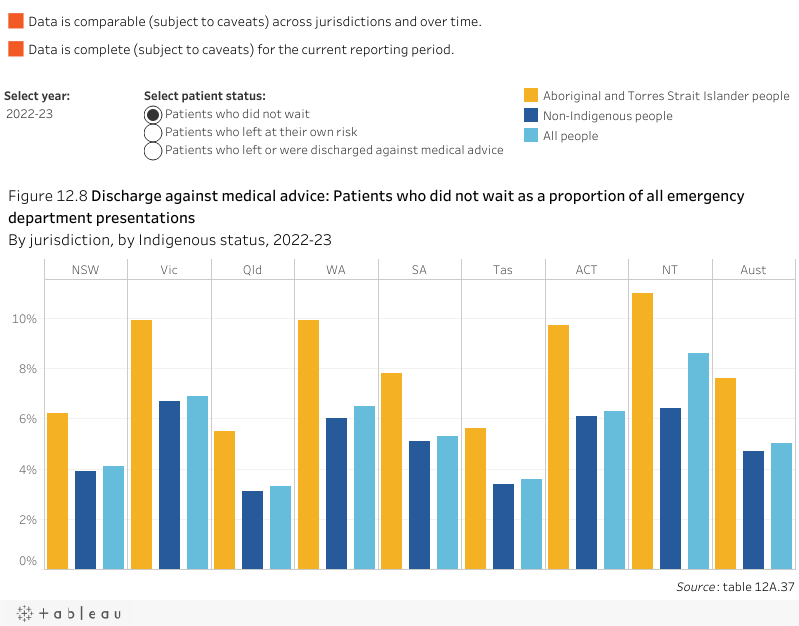
'Appropriateness of hospital services’ is an indicator of governments’ objective to provide care that is appropriate and responsive to the needs of individuals throughout their lifespan and communities.
'Appropriateness of hospital services’ is defined as the proportion of patients who discharge against medical advice and is measured as:
- Emergency department presentations:
- patients who did not wait, as a proportion of all emergency department presentations
- patients who left at their own risk, as a proportion of all emergency department presentations
- Admitted patient care separations:
- patients who left or were discharged against medical advice, as a proportion of all hospital separations.
'Did not wait' refers to patients who did not wait for clinical care to commence or medical assessment following triage in the emergency department. 'Left at own risk' refers to patients who left against advice after treatment had commenced. This includes patients who were planned for admission but who did not physically leave the emergency department prior to departing. 'Discharge against medical advice' refers to patients who were admitted to hospital and left against the advice of their treating physician.
Patients who do not wait, leave at their own risk and discharge against medical advice are at an increased risk of complications, readmission and mortality. Patients leave hospital against medical advice for a variety of reasons, including long waiting times, they begin to feel better, family and employment responsibilities or a lack of cultural safety (AIHW 2024e). These factors, together with interpersonal and institutional racism, contribute to the disproportionately higher rates of Aboriginal and Torres Strait Islander (First Nations) people self‑discharging from hospital.
Low or decreasing proportions of patients who do not wait, leave at own risk and discharge against medical advice are desirable.
Broader, system-level definitions of appropriate health care include dimensions such as evidence‑based care, variations in clinical practice and resource use. Additional measures for this indicator will be considered for inclusion in future editions of this report.
Nationally in 2022-23, 5.0% of emergency department presentations did not wait, while 3.5% of emergency department presentations left at their own risk. Additionally, 1.2% of admitted patients left or were discharged against medical advice (Figure 12.8). Proportions for all measures were higher for Aboriginal and Torres Strait Islander people than for non‑Indigenous people (table 12A.37).
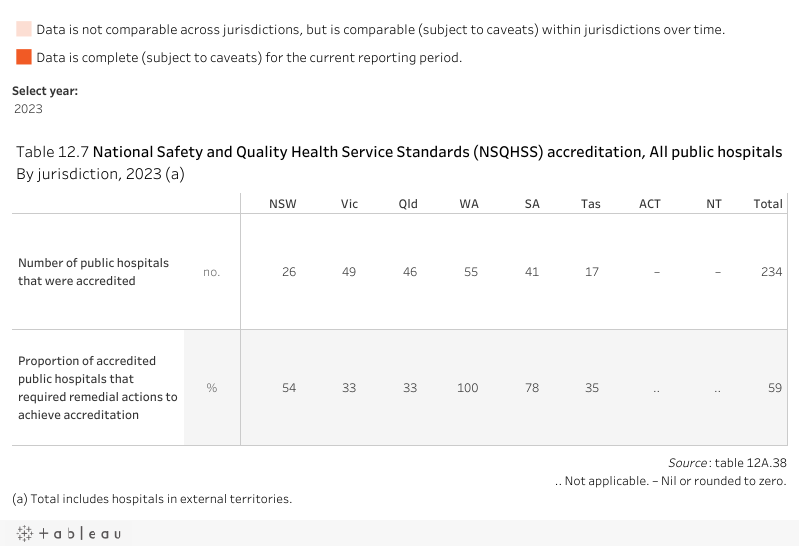
‘Accreditation’ is an indicator of governments’ objective to provide public hospital services that are high quality and safe.
‘Accreditation’ is defined as public hospitals accredited to the National Safety and Quality Health Service (NSQHS) Standards (the Standards) and is measured as:
- the number of public hospitals accredited, as a proportion of all public hospitals with completed accreditation assessments in the same calendar year
- the number of public hospitals accredited during the calendar year that required remedial actions to achieve accreditation, as a proportion of all public hospitals accredited during the same calendar year.
It is mandatory for all Australian hospitals and day procedure services to be accredited to the NSQHS Standards. Health service organisations must demonstrate that they meet all relevant requirements in the NSQHS Standards to achieve accreditation. Health service organisations are assessed to the NSQHS Standards every three years. The NSQHS Standards are:
- Clinical governance
- Partnering with consumers
- Preventing and controlling infections
- Medication safety
- Comprehensive care
- Communicating for safety
- Blood management
- Recognising and responding to acute deterioration.
A high or increasing rate of accreditation is desirable. Accreditation against the NSQHS Standards is evidence that a hospital has been able to demonstrate that safety and quality systems and processes are in place to prevent or minimise patient harm. It does not mean that an accredited hospital will always provide high quality and safe care.
In July 2023, short notice accreditation assessments became mandatory for hospitals.
There are differences across jurisdictions in the mix of hospitals that were assessed (for example, large metropolitan hospitals and small rural services). This indicator should be interpreted in conjunction with other indicators of public hospital quality and safety.
Nationally, in 2023, 59.0% of public hospitals that were accredited during the year required remedial actions to achieve accreditation (table 12.7). This is 18.0 percentage points higher than the proportion that required remedial actions in 2022 (41.0%) (table 12A.38). The national accreditation program was suspended between March 2020 and October 2021, due to the COVID-19 pandemic. During this time, hospitals and day procedure services maintained their existing accreditation status (ACSQHC 2020) and were required to continue to comply with the NSQHS Standards.
‘Adverse events in public hospitals’ is an indicator of governments’ objective to provide public hospital services that are high quality and safe. Sentinel events, which are a subset of adverse events that result in death or very serious harm to the patient, are reported as a separate output indicator.
‘Adverse events in public hospitals’ is defined by three measures:
- Selected healthcare-associated infections
- Adverse events treated in hospitals
- Falls resulting in patient harm in hospitals.
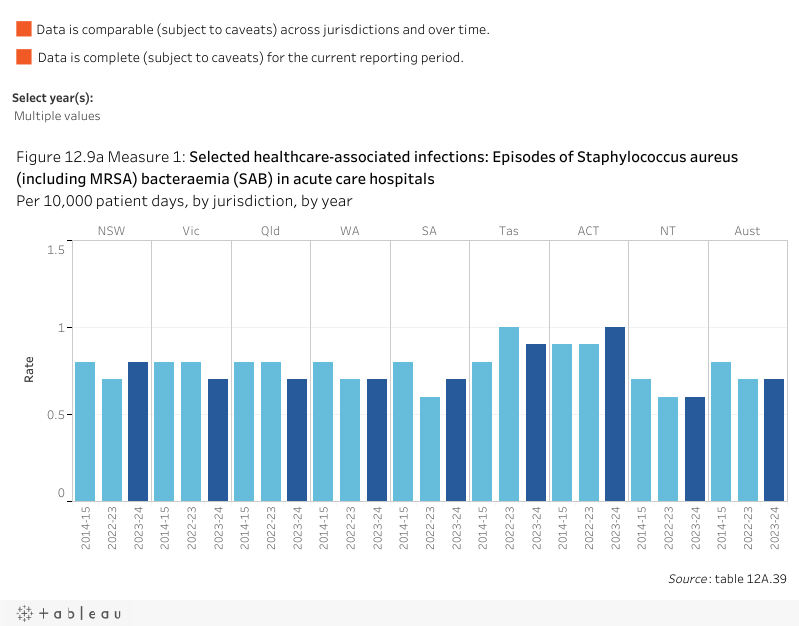
Selected healthcare-associated infections
‘Selected healthcare-associated infections’ is the number of Staphylococcus aureus (including Methicillin‑resistant Staphylococcus aureus [MRSA]) bacteraemia (SAB) patient episodes associated with public hospitals (admitted and non-admitted patients), expressed as a rate per 10,000 patient days for public hospitals.
A patient episode of SAB is defined as a positive blood culture for SAB. Only the first isolate per patient is counted, unless at least 14 days has passed without a positive blood culture, after which an additional episode is recorded.
SAB is considered to be healthcare‑associated if the first positive blood culture is collected more than 48 hours after hospital admission or less than 48 hours after discharge, or if the first positive blood culture is collected less than or equal to 48 hours after admission to hospital and the patient episode of SAB meets at least one of the following criteria:
- SAB is a complication of the presence of an indwelling medical device
- SAB occurs within 30 days of a surgical procedure where the SAB is related to the surgical site
- SAB was diagnosed within 48 hours of a related invasive instrumentation or incision
- SAB is associated with neutropenia contributed to by cytotoxic therapy. Neutropenia is defined as at least two separate calendar days with values of absolute neutrophil count (ANC) or total white blood cell count <500 cell/mm3 (0.5 × 10⁹/L) on or within a seven-day time period which includes the date the positive blood specimen was collected (Day 1), the three calendar days before and the three calendar days after.
Cases where a known previous positive test was obtained within the past 14 days are excluded. Patient days for unqualified newborns, hospital boarders and posthumous organ procurement are excluded.
A low or decreasing rate of selected healthcare-associated infections is desirable.
Measure 1: Nationally in 2023-24, the rate of selected healthcare-associated infections was 0.7 per 10,000 patient days; a rate largely unchanged over the reported ten-year time series (figure 12.9a).
Adverse events treated in hospitals
‘Adverse events treated in hospitals’ are incidents in which harm resulted to a person during hospitalisation and are measured by separations that had an adverse event (including infections, falls resulting in injuries and problems with medication and medical devices) that occurred during hospitalisation. Hospital separations data includes information on diagnoses and place of occurrence that can indicate that an adverse event was treated and/or occurred during the hospitalisation, but some adverse events are not identifiable using these codes.
Low or decreasing adverse events treated in hospitals are desirable.
Measure 2: Nationally, in 2022-23, 6.4% of separations in public hospitals had an adverse event reported during hospitalisation (table 12.8). Results by category (diagnosis, external cause and place of occurrence of the injury or poisoning) are in table 12A.40.
Falls resulting in patient harm in hospitals
‘Falls resulting in patient harm in hospitals’ is defined as the number of separations with an external cause code for fall and a place of occurrence of health service area, expressed as a rate per 1,000 hospital separations. It is not possible to determine if the place of occurrence was exclusively within a hospital, only that it was a health service area, which alongside hospitals include day procedure centres, health centres, hospices and outpatient clinics.
A low or decreasing rate of falls resulting in patient harm in hospitals is desirable.
Measure 3: Nationally in 2022-23, the rate of falls resulting in patient harm was 6.4 per 1,000 hospital separations (public hospitals); results varied across states and territories (figure 12.9b). Data is reported by Indigenous status and remoteness in table 12A.41.
‘Sentinel events’ is an indicator of governments’ objective to deliver public hospital services that are high quality and safe. Sentinel events are a subset of adverse events that result in death or very serious harm to a patient. Adverse events are reported as a separate output indicator.
‘Sentinel events’ is defined as the number of reported adverse events that occur because of hospital system and process deficiencies, and which result in the death of, or serious harm to, a patient. Sentinel events occur relatively infrequently and are independent of a patient’s condition.
Australian health ministers agreed version 2 of the Australian sentinel events list in December 2018. All jurisdictions implemented these categories on 1 July 2019. The national sentinel events are:
- Surgery or other invasive procedure performed on the wrong site resulting in serious harm or death
- Surgery or other invasive procedure performed on the wrong patient resulting in serious harm or death
- Wrong surgical or other invasive procedure performed on a patient resulting in serious harm or death
- Unintended retention of a foreign object in a patient after surgery or other invasive procedure resulting in serious harm or death
- Haemolytic blood transfusion reaction resulting from ABO blood type incompatibility resulting in serious harm or death
- Suspected suicide of a patient in an acute psychiatric unit or acute psychiatric ward
- Medication error resulting in serious harm or death
- Use of physical or mechanical restraint resulting in serious harm or death
- Discharge or release of an infant or child to an unauthorised person
- Use of an incorrectly positioned oro-or naso-gastric tube resulting in serious harm or death.
A low or decreasing number of sentinel events is desirable.
All state and territory governments have implemented sentinel event reporting programs. The purpose of these programs is to facilitate a safe environment for patients by reducing the frequency of these events. The programs are not punitive and are designed to facilitate self‑reporting of errors so that the underlying causes of events can be examined, and action taken to reduce the risk of these events re-occurring.
Changes in the number of sentinel events reported over time do not necessarily mean that Australian public hospitals have become more or less safe, but might reflect improvements in incident reporting mechanisms, organisational cultural change, and/or an increasing number of hospital admissions (this data is reported as numbers rather than rates). Sentinel event should be monitored over time to identify trends and establish underlying reasons.
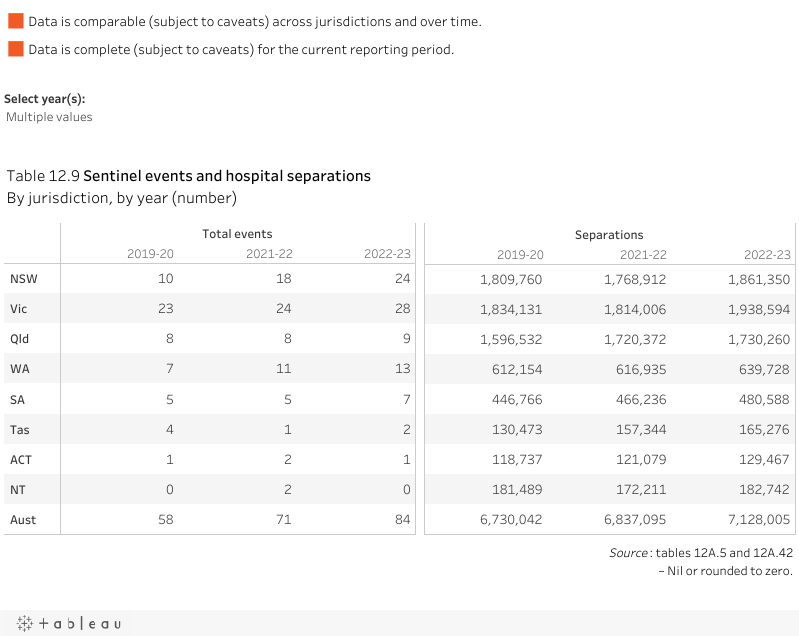
Nationally, in 2022-23, there was a total of 84 sentinel events, 13 more than in 2021-22 (table 12.9). As larger states and territories will tend to have more sentinel events than smaller jurisdictions, the number of separations is also presented to provide context. In 2022-23, 60.7% of sentinel events were medication errors resulting in serious harm or death (12A.42). Data disaggregated by the type of sentinel event is reported in table 12A.42.
‘Patient satisfaction’ provides a proxy measure of governments’ objective to deliver services that are responsive to individuals throughout their lifespan and communities.
‘Patient satisfaction’ is defined by two measures:
- Proportion of people who visited a hospital emergency department in the last 12 months for their own health reporting that the emergency department doctors, specialists or nurses ‘always’ or ‘often’:
- listened carefully to them
- showed respect to them
- spent enough time with them
- Proportion of people who were admitted to hospital in the last 12 months reporting that the hospital doctors, specialists or nurses ‘always’ or ‘often’:
- listened carefully to them
- showed respect to them
- spent enough time with them.
A high or increasing proportion of patients who were satisfied is desirable, as it suggests high quality hospital care that meets patient needs and expectations.
The ABS Patient Experience Survey of people aged 15 years and over does not include people living in discrete Indigenous communities, which affects the representativeness of the Northern Territory results. Approximately 20% of the resident population of the Northern Territory live in discrete Indigenous communities as of 2020‑21.
Measure 1: Nationally, in 2023-24, the proportion of respondents across all areas reporting that emergency department doctors, specialists or nurses always or often listened carefully and showed respect was above 83.6%. The proportion of respondents who reported that emergency department doctors or specialists always or often spent enough time with them was 79.3% compared to 85.2% who reported that emergency department nurses always or often spent enough time with them (figure 12.10a).
Measure 2: Nationally, in 2023-24, the proportion of respondents across all areas reporting that hospital doctors, specialists or nurses listened carefully, showed respect and spent enough time with them was above 86.8% (figure 12.10b).
‘Continuity of care’ is an indicator of governments' objective to provide care that is well co‑ordinated where more than one service type, and/or ongoing service provision is required.
‘Continuity of care’ is defined as the proportion of patients who reported that arrangements were not made by their hospital for any services needed after leaving hospital when last admitted.
A low or decreasing proportion of patients reporting that arrangements were not made by their hospital for any services needed after leaving hospital when last admitted is desirable.
This indicator is currently under development for reporting in the future.
‘Selected unplanned hospital readmission rates’ is an indicator of governments’ objective to provide public hospital services that are of high quality and well-coordinated to ensure continuity of care.
‘Selected unplanned hospital readmission rates’ is defined as the rate at which patients unexpectedly return to the same hospital within 28 days for further treatment where the original admission involved one of a selected set of procedures, and the readmission is identified as a post-operative complication. It is expressed as a rate per 1,000 separations in which one of the selected surgical procedures was performed. The indicator is an underestimate of all possible unplanned/unexpected readmissions.
The selected surgical procedures are knee replacement, hip replacement, tonsillectomy and adenoidectomy, hysterectomy, prostatectomy, cataract surgery and appendectomy. Unplanned readmissions are those having a principal diagnosis of a post-operative adverse event for which a specified ICD-10-AM diagnosis code has been assigned.
Low or decreasing rates of unplanned readmissions are desirable. Conversely, high or increasing rates suggest the quality of care provided by hospitals, or post-discharge care or planning, should be examined, because there may be scope for improvement.
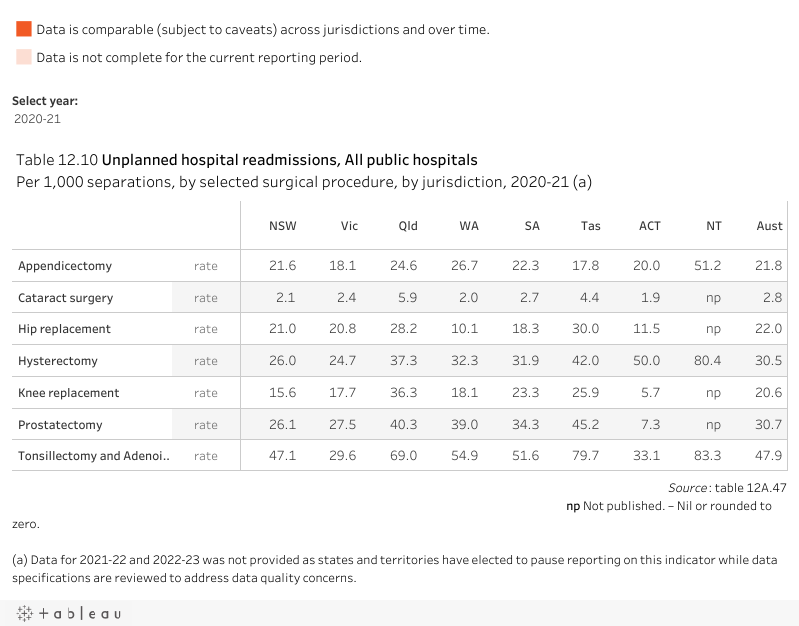
Data for 2021-22 and 2022-23 was not provided as states and territories have elected to pause reporting on this indicator while data specifications are reviewed to address data quality concerns. Reporting is expected to resume in time for inclusion in the 2026 report. This may be on the basis of updated specifications or a suitable alternative indicator, for example, the National Health Reform Agreement indicator ‘Avoidable hospital readmissions’ as published by the Independent Health and Aged Care Pricing Authority (IHACPA).
Of the selected surgical procedures in 2020-21, readmission rates were highest nationally, and for most jurisdictions, for tonsillectomy and adenoidectomy, with the rate increasing from 27.8 to 47.9 readmissions per 1,000 separations over the past 10 years (table 12.10). Selected unplanned hospital readmission rates are reported by hospital peer group, Indigenous status, remoteness and socioeconomic status in table 12A.48.
‘Workforce sustainability’ is an indicator of governments’ objective to provide sustainable public hospital services. Health workforce sustainability relates to the capacity of the health workforce to meet current and projected future service demand. ‘Workforce sustainability’ is defined by two measures:
- the proportions of registered nurses and midwives, and medical practitioners in ten-year age brackets, by jurisdiction and by region
- the attrition rate of nurses and midwives, and medical practitioners, by jurisdiction.
Both measures report on full time equivalent (FTE) nurses, midwives and medical practitioners performing public clinical hours in public hospital settings.
These measures are not a substitute for a full workforce analysis that allows for training, migration, changing patterns of work and expected future demand. They can, however, indicate that further attention should be given to workforce planning for public hospital services.
High or increasing proportions of the workforce that are new entrants and/or low or decreasing proportions of the workforce that are close to retirement are desirable. A low or decreasing rate of workforce attrition is desirable.
Workforce age profiles
Nationally, across all areas in 2023, 8.4% of the full-time equivalent nursing workforce were aged 60 years and over (figure 12.11a). Since 2014, the proportion of nurses and midwives aged under 40 years has increased by 11.4 percentage points (table 12A.49). The proportion of Aboriginal and Torres Strait Islander people who are registered or enrolled as nurses and midwives is presented in table 12A.50.
For the medical practitioner workforce, the proportion aged 60 years and over across all areas was 5.8% in 2023 (figure 12.11b). Unlike the nursing workforce, the proportion of the medical practitioner workforce aged under 40 years has remained around 61.0% since 2014 (table 12A.51). The number and proportion of Aboriginal and Torres Strait Islander people who are medical practitioners is in table 12A.52.
Workforce attrition rates
Public hospital attrition rates are calculated using the FTE of nurses and midwives, and medical practitioners who left the workforce in a public hospital setting (i.e., who were not in the workforce in a public hospital setting in the current year but who were in the workforce in a public hospital setting in the previous year), divided by the total FTE of nurses, midwives and medical practitioners employed in the workforce in a public hospital setting in the previous year.
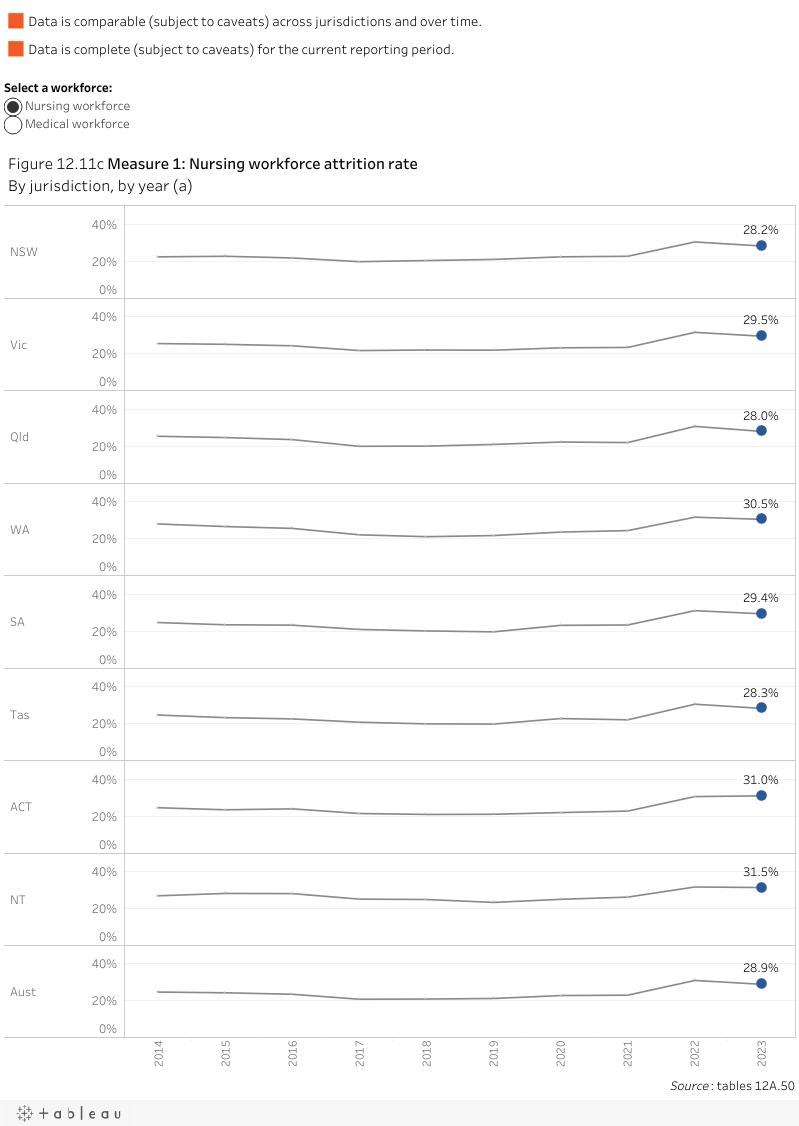
Nationally, in 2023, the attrition rate for nurses and midwives working in public hospital settings was 28.9%, lower than 2022 (31.0%), but the second highest rate over the reported 10 year time series. Nationally, in 2023, the attrition rate for medical practitioners was 22.9%, unchanged from 2022 (figure 12.11c).
‘Cost per admitted patient separation’ is an indicator of governments’ objective to deliver services in an efficient manner.
‘Cost per admitted patient separation’ is defined by the following two measures:
- Recurrent cost per weighted separation
- Capital cost per weighted separation.
A low or decreasing recurrent cost per weighted separation or capital cost per weighted separation can reflect more efficient service delivery in public hospitals. However, this indicator should be viewed in the context of the performance indicator framework as a whole, as decreasing cost could also be associated with decreasing quality and effectiveness.
Recurrent cost per weighted separation
‘Recurrent cost per weighted separation’ is the average cost of providing care for an admitted patient (overnight stay or same day) adjusted for casemix. Casemix adjustment takes account of variation in the relative complexity of a patient’s clinical condition and of the hospital services provided, but not other influences on length of stay.
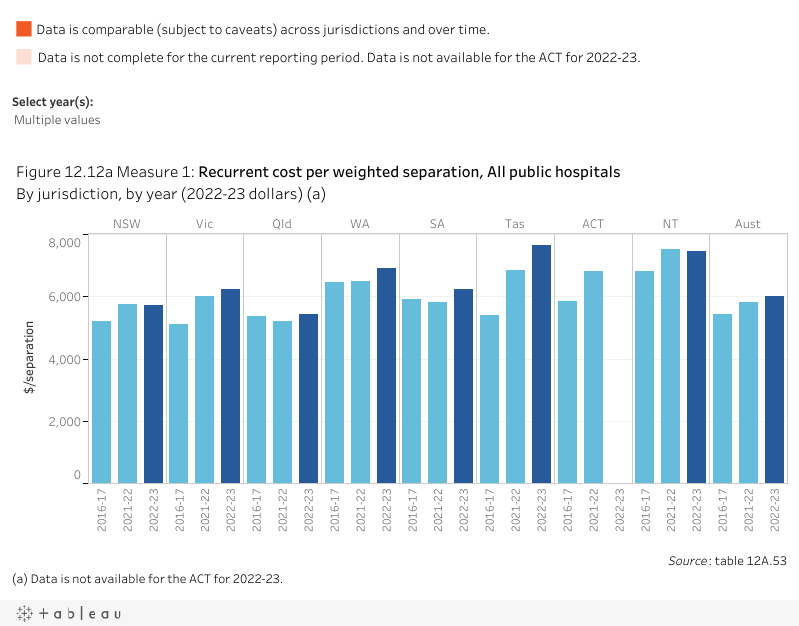
Measure 1: Nationally, in 2022-23 (excluding the Australian Capital Territory), the average recurrent cost per weighted separation was $6,006, an increase from $5,826 in 2021-22 (figure 12.12a). Data on the average cost per admitted patient separation is available on the subset of presentations that are acute emergency department presentations (table 12A.55).
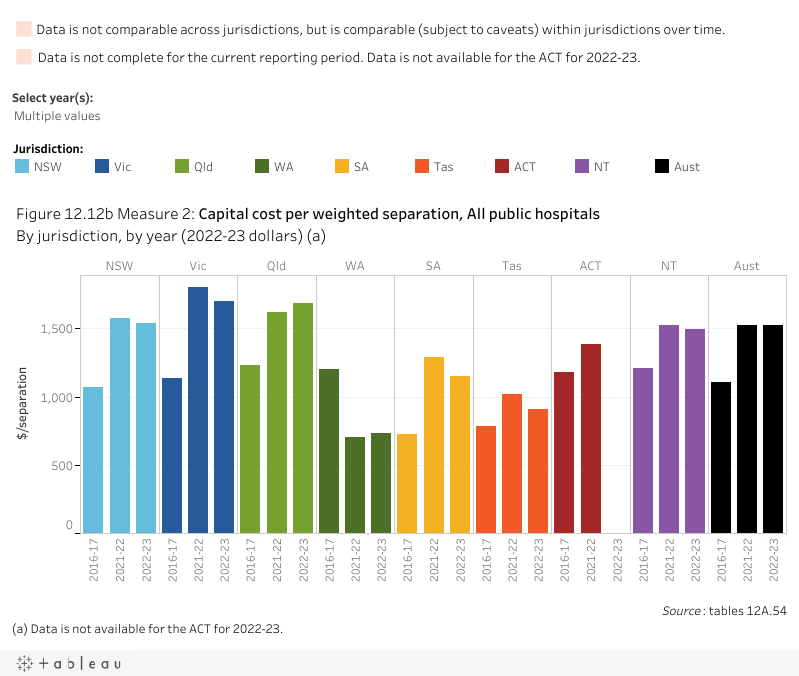
Capital cost per weighted separation
‘Capital cost per weighted separation’ is defined as the user cost of capital (calculated as 8% of the value of non‑current physical assets including buildings and equipment but excluding land) plus depreciation, divided by the number of weighted separations.
This measure allows the full cost of hospital services to be considered. Depreciation is defined as the cost of consuming an asset’s services. It is measured by the reduction in value of an asset over the financial year. The user cost of capital is the opportunity cost of the capital invested in an asset and is equivalent to the return foregone from not using the funds to deliver other services or to retire debt. Interest payments represent a user cost of capital, so are deducted from capital costs to avoid double counting.
Measure 2: Costs associated with non-current physical assets are important components of the total costs of many services delivered by government agencies. Nationally, in 2022-23 (excluding the Australian Capital Territory), the total capital cost (excluding land) per weighted separation was $1,527 (figure 12.12b).
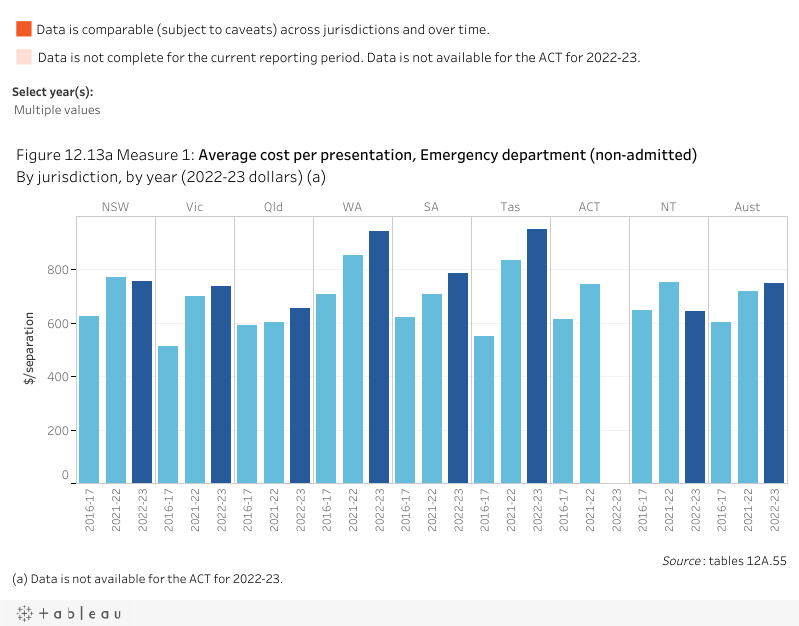
‘Recurrent cost per non-admitted patient’ is an indicator of governments’ objective to deliver services in an efficient manner.
‘Recurrent cost per non-admitted patient’ is defined by the following two measures:
- Average cost per non-admitted acute emergency department presentation
- Average cost per non-admitted service event.
A low or decreasing recurrent cost per non-admitted patient can reflect more efficient service delivery in public hospitals. However, this indicator should be viewed in the context of the set of performance indicators as a whole, as decreasing cost could also be associated with decreasing quality and effectiveness. This indicator does not adjust for the complexity of service.
Measure 1: Nationally, in 2022-23 (excluding the Australian Capital Territory), the average cost per non‑admitted emergency department presentation was $749 (figure 12.13a). Costs per non-admitted emergency department presentation have increased over the seven years of reported data.
Measure 2: Nationally, in 2022-23 (excluding the Australian Capital Territory), the average cost per non‑admitted service event was $382, up from $324 in 2021-22 (figure 12.13b).

‘Hospital mortality’ is an indicator of governments’ objective to alleviate or manage illness and the effects of injury and provide high quality and safe care.
‘Hospital mortality’ is defined as death in low-mortality diagnostic related groups (DRGs) expressed as a rate. Low‑mortality DRGs comprise diagnoses that have a very low chance of death (for example, headache, hand procedures, arthroscopy).
Low or decreasing rates of death in low-mortality DRGs can indicate more effective management of illness and the effects of injury.
In 2009, Australian Health Ministers agreed state and territory hospital mortality data should be gathered and presented to hospitals for regular review. The hospital mortality indicators endorsed by Health Ministers include 'death in low mortality DRGs', 'hospital-standardised mortality ratios' and 'in-hospital mortality for four specified conditions' (acute myocardial infarction, stroke, fractured neck of femur and pneumonia) (ACSQHC 2014).
Hospital mortality indicators can act as screening tools to flag potential issues for further clinical review. Hospital mortality data should be considered as part of a suite of patient safety metrics including hospital‑acquired infection, patient experience data and readmission rates.
In the absence of national data development to support reporting on this indicator, Table 12.11 provides an overview of the review mechanisms in place across states and territories for examining in-hospital deaths.
| NSW | NSW reports publicly on selected mortality in hospitals data. The report 'Mortality following hospitalisation for seven clinical conditions' provides information on patient deaths within 30 days of admission across 73 public hospitals for seven clinical conditions during the period July 2015 to June 2018 |
|---|---|
| Vic | Victoria does not report publicly on this data. However, Victoria reports internally on three indicators based on the Core Hospital-Based Outcome Indicator (CHBOI) specifications published by the Australian Commission on Safety and Quality in Health Care (ACSQHC) In-hospital Mortality for Fractured Neck-of-Femur, Acute Myocardial Infarction and Pneumonia, as well as two locally developed mortality indicators for ischaemic and haemorrhagic stroke and a Gestationally Standardised Perinatal Mortality Ratio. Outliers for these indicators are reviewed on a regular basis by Safer Care Victoria, the Department of Health and respective health services as part of the performance monitoring process. In addition, the Victorian Perioperative Consultative Council oversees, reviews and analyses cases of perioperative mortality and morbidity in Victoria and the Consultative Council for Obstetric and Perinatal Morbidity and Mortality (CCOPMM) reviews and reports on all child deaths in Victoria, including in-hospital deaths. Victoria also reports internally on four in-hospital mortality indicators (for Stroke, Fractured Neck of Femur, Acute Myocardial Infarction and Pneumonia) via the Victorian Agency for Health Information Private Hospitals Quality and Safety Report. |
| Qld | Queensland does not report publicly on this data. Queensland Hospital and Health Services undertake 'outlier' reviews of in-hospital deaths which are reviewed by a statewide committee to ensure the review is thorough and actions are identified for any issues found. The need for review is identified through monitoring condition or procedure specific indicators (AMI, Heart Failure, Stroke, Fractured Neck of Femur and Pneumonia) and system-wide mortality indicators i.e. low‑mortality DRG and hospital standard mortality ratio (HSMR). In addition, morbidity and mortality meetings are held at a local level. Further, Quality Assurance Committees (QAC) identify common issues across the state to identify lessons learnt and/or recommendations for consideration statewide and locally. Other QACs, for example, Queensland Audit of Surgical Mortality provide individual feedback to practitioners to improve individual performance. |
| WA | WA does not report publicly on this data. WA Health currently reports six indicators internally that are based on the Core Hospital Based Outcome Indicator (CHBOI) specifications published by the Australian Commission on Safety and Quality in Health Care (ACSQHC); Hospital Standardised Mortality Ratio, In‑hospital Mortality (for Stroke, Fractured Neck-of-Femur, Acute Myocardial Infarction and Pneumonia) and Death in Low Mortality Diagnosis‑Related Groups. Outliers for these indicators are reviewed on a regular basis through the WA Health system Quality Surveillance Group (QSG). Note that the results of mortality reviews as undertaken by local Mortality Committees are publicly available from the annual WA Health Your safety in our hands in hospital patient safety report. |
| SA | SA does not report publicly on this data. For internal mortality analysis, SA uses national Core hospital based outcome indicators (CHBOI) developed by the ACSQHC. Examples include: monitoring Hospital standardised mortality ratios (HSMR) (included as a key performance indicator in service agreements) and monitoring CHBOI condition-specific mortality measures (fractured neck of femur, stroke, AMI and pneumonia). |
| Tas | Tasmania does not report publicly on this data. Hospital mortality is reported internally using the Hospital Diagnosis Standardised Mortality Ratio, provided by the Health Roundtable (https://home.healthroundtable.org/), and hospital‑wide and condition/procedure specific mortality as per the Core Hospital-Based Outcome Indicator (CHBOI) specifications developed by the ACSQHC. Morbidity and Mortality reviews are undertaken across the health service to promote safety and quality improvement. Tasmania also uses CHBOI-based outcome indicators of safety and quality. This reporting system has included in‑hospital mortality and unplanned/unexpected hospital re-admissions, as developed by the ACSQHC. These indicators are designed as screening tools for internal safety and quality improvement, and they are not intended to be used as performance measures. |
| ACT | The ACT does not report publicly on these data. Mortality information from Canberra Health Services (CHS) is collated by the Health Round Table (HRT) and includes deaths in low mortality DRGs and is defined by the ACSQHC and adopted by the Independent Health and Aged Care Pricing Authority (IHACPA). These may not necessarily be avoidable when investigated. Sentinel events are reported to ACT Health Directorate for inclusion in IHACPA reporting. In addition, Morbidity and Mortality meetings are held at a local level. The ACT Children and Young People Death Review Committee reviews all deaths of children and young people aged from birth to 18 years. This committee reports annually to the Minister for Children, Youth and Families and the statistics are published here: https://www.childdeathcommittee.act.gov.au/publications. The ACT Maternal and Perinatal Mortality Committee reviews all deaths of women who died while pregnant or up to 42 days post-partum and all deaths of fetuses from 20 weeks gestation and babies up to 28 days of life. Maternal death information is included in national reports but is not published specifically for the ACT due to the very small number of deaths in the ACT. The perinatal death rate is published annually here: https://health.act.gov.au/about‑our‑health‑system/data‑and‑publications/healthstats/statistics-and-indicators/perinatal and a detailed report is provided by the Committee to the ACT Chief Health Officer and published every five years https://health.act.gov.au/about‑our‑health‑system/data‑and‑publications/healthstats/epidemiology-publications. |
| NT | The NT does not report publicly on this data. The NT uses national Core hospital based outcome indicators (CHBOIs) developed by the ACSQHC. CHBOI 1 - Hospital Standardised Mortality Ratio (HSMR); CHBOI 2 - Death in low‑mortality Diagnosis Related Groups (DRGs); CHBOI 3: Condition Specific Mortality Measures. This data is included in the internal NT Health Patient Quality and Safety Surveillance Quarterly Report. The NT also provides data on coronial recommendations, Incident Severity Rating 1 events (ISR1s), and national sentinel events. |
Sources: State and Territory governments (unpublished).
Performance indicator data for Aboriginal and Torres Strait Islander people in this section is available in the data tables listed below. Further supporting information can be found in the Indicator results tab and data tables.
| Table number | Table title |
|---|---|
| Table 12A.15 | Patients treated within national benchmarks for emergency department waiting time, by Indigenous status |
| Table 12A.19 | Length of stay for emergency department care, proportion of patients staying for four hours or less, by Indigenous status |
| Table 12A.24 | Waiting times for elective surgery in public hospitals, by state and territory, by Indigenous status and procedure |
| Table 12A.37 | Patients who did not wait, left or were discharged against medical advice, by Indigenous status (public hospitals) |
| Table 12A.41 | Separations for falls resulting in patient harm in hospitals, per 1,000 separations |
| Table 12A.48 | Unplanned readmission rates in public hospitals, by Indigenous status, hospital peer group, remoteness and SEIFA IRSD quintiles |
| Terms | Definition |
|---|---|
| Accreditation | Professional recognition awarded to hospitals and other healthcare facilities that meet defined industry standards. Public hospitals can seek accreditation through the Australian Council on Healthcare Standards Evaluation and Quality Improvement Program, the Australian Quality Council (now known as Business Excellence Australia), the Quality Improvement Council, the International Organisation for Standardization 9000 Quality Management System or other equivalent programs. |
| Acute care | Clinical services provided to admitted patients, including managing labour, curing illness or treating injury, performing surgery, relieving symptoms and/or reducing the severity of illness or injury, and performing diagnostic and therapeutic procedures. |
| Admitted patient | A patient who undergoes a hospital’s admission process to receive treatment and/or care. This treatment and/or care is provided over a period of time and can occur in hospital and/or in the person’s home (for hospital-in-the-home patients). |
| Allied health professionals | Trained professionals with university qualifications (other than qualified medical or nursing staff) who are engaged in duties of a diagnostic, professional or technical nature. This category includes physiotherapists, psychologists, social workers, occupational therapists, Aboriginal and Torres Strait Islander health practitioners, and other diagnostic and health professionals. |
| Australian classification of health interventions (ACHI) | Developed by the National Centre for Classification in Health, the ACHI comprises a tabular list of health interventions and an alphabetic index of health intervention. |
| Australian Refined Diagnosis Related Group (AR-DRG) | AR-DRG is a patient classification system that hospitals use to match their patient services (hospital procedures and diagnoses) with their resource needs. AR-DRG version 6.0x is based on the ICD-10-AM classification. |
| Casemix adjusted | Adjustment of data on cases treated to account for the number and type of cases. Cases are sorted by AR‑DRG into categories of patients with similar clinical conditions and requiring similar hospital services. Casemix adjustment is an important step to achieving comparable measures of efficiency across hospitals and jurisdictions. |
| Casemix adjusted separations | The number of separations adjusted to account for differences across hospitals in the complexity of episodes of care. |
| Community health services | Health services for individuals and groups delivered in a community setting, rather than via hospitals or private facilities. |
| Comparability | Data is considered comparable if (subject to caveats) it can be used to inform an assessment of comparative performance. Typically, data is considered comparable when it is collected in the same way and in accordance with the same definitions. For comparable indicators or measures, significant differences in reported results allow an assessment of differences in performance, rather than being the result of anomalies in the data. |
| Completeness | Data is considered complete if all required data is available for all jurisdictions that provide the service. |
| Cost of capital | The return foregone on the next best investment, estimated at a rate of 8% of the depreciated replacement value of buildings, equipment and land. Also called the ‘opportunity cost’ of capital. |
| Elective surgery waiting times | Elective surgery waiting times are calculated by comparing the date on which patients are added to a waiting list with the date on which they are admitted for the awaited procedure. Days on which the patient was not ready for care are excluded. |
| Emergency department waiting time to commencement of clinical care | The time elapsed for each patient from presentation to the emergency department (that is, the time at which the patient is clerically registered or triaged, whichever occurs earlier) to the commencement of service by a treating medical officer or nurse. |
| Emergency department waiting times to admission | The time elapsed for each patient from presentation to the emergency department to admission to hospital. |
| International Statistical Classification of Diseases - 10th Revision - Australian modification | The International Statistical Classification of Diseases and Related Health Problems - 10th Revision - Australian modification (ICD-10-AM) is the current classification of diagnoses in Australia. |
| Hospital boarder | A person who is receiving food and/or accommodation but for whom the hospital does not accept responsibility for treatment and/or care. |
| Length of stay | For an episode of care, the period from admission to separation less any days spent away from the hospital (leave days). |
| Medicare | Australian Government funding of private medical and optometrical services (under the Medicare Benefits Schedule). Sometimes defined to include other forms of Australian Government funding such as subsidisation of selected pharmaceuticals (under the Pharmaceutical Benefits Scheme) and public hospital funding (under the Australian Health Care Agreements), which provides public hospital services free of charge to public patients. |
| Newborn qualification status | A newborn qualification status is assigned to each patient day within a newborn episode of care. A newborn patient day is qualified if the infant meets at least one of the following criteria:
A newborn patient day is unqualified if the infant does not meet any of the above criteria. The day on which a change in qualification status occurs is counted as a day of the new qualification status. If there is more than one qualification status in a single day, the day is counted as a day of the final qualification status for that day. |
| Nursing and midwifery workforce | Registered nurses, enrolled nurses and midwives registered with the Australian Health Practitioner Regulation Agency and who are employed in nursing and/or midwifery in Australia excluding those on extended leave. |
| Medical practitioner workforce | Medical practitioners registered with the Australian Health Practitioner Regulation Agency and who are employed in medicine in Australia excluding those on extended leave. |
| Non-acute care | Includes maintenance care and newborn care (where the newborn does not require acute care). |
| Non-admitted occasions of service | Occasion of examination, consultation, treatment or other service provided to a non‑admitted patient in a functional unit of a health service establishment. Services can include emergency department visits, outpatient services (such as pathology, radiology and imaging, and allied health services, including speech therapy and family planning) and other services to non‑admitted patients. Hospital non-admitted occasions of service are not yet recorded consistently across states and territories, and relative differences in the complexity of services provided are not yet documented. |
| Non-admitted patient | A patient who has not undergone a formal admission process, but who may receive care through an emergency department, outpatient or other non-admitted service. |
| Peer group(s) | Peer groups are used to categorise similar hospitals with shared characteristics. Categorising hospitals in peer groups allows for valid comparisons to be made across similar hospitals providing similar services. The peer groups are:
For further details on hospital peer groups, refer to AIHW (2015) Australian hospital peer groups. Health services series no. 66. Cat. no. HSE 170. Canberra: AIHW (https://www.aihw.gov.au/reports/hospitals/australian-hospital-peer-groups/data) |
| Posthumous organ procurement | An activity undertaken by hospitals in which human tissue is procured for the purpose of transplantation from a donor who has been declared brain dead. |
| Public hospital | A hospital that provides free treatment and accommodation to eligible admitted persons who elect to be treated as public patients. It also provides free services to eligible non-admitted patients and can provide (and charge for) treatment and accommodation services to private patients. |
| Real expenditure | Actual expenditure adjusted for changes in prices. |
| Relative stay index | The actual number of patient days for acute care separations in selected AR–DRGs divided by the expected number of patient days adjusted for casemix. Includes acute care separations only. Excludes: patients who died or were transferred within 2 days of admission, or separations with length of stay greater than 120 days, AR-DRGs which are for ‘rehabilitation’, AR‑DRGs which are predominantly same day (such as R63Z chemotherapy and L61Z admit for renal dialysis), AR‑DRGs which have a length of stay component in the definition, and error AR-DRGs. |
| Same day patients | A patient whose admission date is the same as the separation date. |
| Sentinel events | Adverse events that cause serious harm to patients and that have the potential to undermine public confidence in the healthcare system. |
| Separation | A total hospital stay (from admission to discharge, transfer or death) or a portion of a hospital stay beginning or ending in a change in the type of care for an admitted patient (for example, acute to rehabilitation). Includes admitted patients who receive same day procedures. |
| Service event | An interaction between one or more health-care provider(s) with one non-admitted patient, which must contain therapeutic or clinical content and result in dated entry in the patient’s medical record. |
| Subacute care | Specialised multidisciplinary care in which the primary need for care is optimisation of the patient’s functioning and quality of life. A person’s functioning may relate to their whole body or a body part, the whole person, or the whole person in a social context, and to impairment of a body function or structure, activity limitation and/or participation restriction. Subacute care comprises the defined care types of rehabilitation, palliative care, geriatric evaluation and management and psychogeriatric care. |
| Triage category | The urgency of the patient’s need for medical and nursing care: category 1 – resuscitation (immediate within seconds) category 2 – emergency (within 10 minutes) category 3 – urgent (within 30 minutes) category 4 – semi-urgent (within 60 minutes) category 5 – non-urgent (within 120 minutes). |
| Urgency category for elective surgery | Category 1 patients – admission within 30 days is desirable for a condition that has the potential to deteriorate quickly to the point that it can become an emergency. Category 2 patients – admission within 90 days is desirable for a condition that is causing some pain, dysfunction or disability, but that is not likely to deteriorate quickly or become an emergency. Category 3 patients – admission at some time in the future is acceptable for a condition causing minimal or no pain, dysfunction or disability, that is unlikely to deteriorate quickly and that does not have the potential to become an emergency. |
ACSQHC (Australian Commission on Safety and Quality in Health Care) 2020, Annual Report 2019-20, https://www.safetyandquality.gov.au/publications-and-resources/resource-library/acsqhc-annual-report-2019-20 (accessed 12 October 2023).
—— 2014 Using hospital mortality indicators to improve patient care: A guide for Boards and Chief Executives, ![]() https://www.safetyandquality.gov.au/sites/default/files/migrated/Using-hospital-mortality-indicators-to-improve-patient-care-A-guide-for-Boards-and-Chief-Executives.pdf (accessed 12 October 2023).
https://www.safetyandquality.gov.au/sites/default/files/migrated/Using-hospital-mortality-indicators-to-improve-patient-care-A-guide-for-Boards-and-Chief-Executives.pdf (accessed 12 October 2023).
AIHW (Australian Institute of Health and Welfare) 2024a, Hospital resources 2022-23: Australian hospital statistics, Health services series, https://www.aihw.gov.au/reports-data/myhospitals/themes/hospital-workforce (Hospital resources 2022-23 data tables, accessed 17 October 2024).
—— 2024b, Australia's hospitals at a glance, https://www.aihw.gov.au/reports/hospitals/australias-hospitals-at-a-glance (accessed 17 December 2024).
—— 2024c, Admitted patient access, https://www.aihw.gov.au/reports-data/myhospitals/intersection/access/apc (accessed 4 November 2024).
—— 2024d, Emergency department care 2022-23: Appendix information, ![]() https://www.aihw.gov.au/getmedia/77b55e9d-a340-4d47-b1fc-001efba9bf17/emergency-department-care-2022-23-appendix.pdf (accessed 4 November 2024).
https://www.aihw.gov.au/getmedia/77b55e9d-a340-4d47-b1fc-001efba9bf17/emergency-department-care-2022-23-appendix.pdf (accessed 4 November 2024).
—— 2024e, 'Self-discharge from hospital' in Aboriginal Torres Strait Islander Health Performance Framework, https://www.indigenoushpf.gov.au/measures/3-09-self-discharge-from-hospital (accessed 22 November 2024).
A PDF of Part E Health can be downloaded from the Part E sector overview page.